Monday
Jun222009
by  Bishop Hill
 Bishop Hill
 How to be speaker
 Jun 22, 2009
  Politicians
  Sleaze
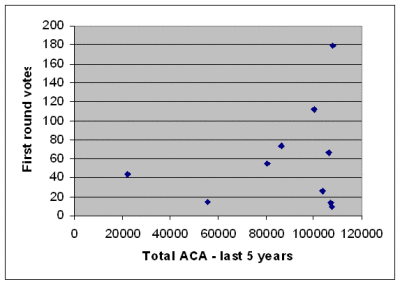
 Here's an amusing little picture. The graph is for the candidates for speaker of the House of Commons and examines the relationship between their expenses - specifically their total Additional Costs allowance for the last five years - and the number of votes they received in the first round. This is the only correlation I can test because it's the only chance people got to vote for the whole field.
Does it look like there's some sort of a relationship there? Looks to me as if money can't buy you love, but unless you are willing to get down and dirty then you're just seen as goody two-shoes.


Reader Comments (3)
This piece says it most eloquently:
http://www.telegraph.co.uk/comment/columnists/simonheffer/5614822/Labour-seems-bent-on-insulting-the-voters-until-the-very-end.html
but will likely make you a tad glum. So try this to help lift your spirits:
http://www.dailymail.co.uk/debate/article-1195335/QUENTIN-LETTS-Mr-Squeaker-crouched-like-gardener-deadheading-rose.html
Actually, no.
Unless you want to claim that the number of votes cast is somehow related to the logarithm of the ACA. I can't imagine any elected officials being able to do that calculation, though it would be an ingenious expense claim.
Besides it doesn't look like that relationship is true either.
If you try asking your spreadsheet to add a regression line and calculate the confidence interval I expect you'll see there is no relationship.
Stop being so serious!