


Discussion > Are Geological Paleo-Climate Records Relevant to The Climate Debate?
Martin A
"I asked about radiative imbalance. You answered with figures derived from sea-level rise.
So, if radiative imbalance is a new thing, does this mean that sea level rise is a new thing too?"
Sorry, I tend to see it as obvious.
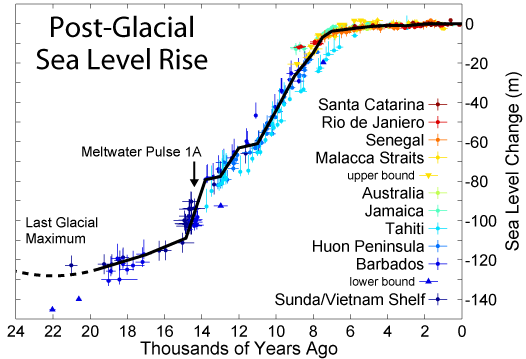
Any ongoing change in global temperatures involves a change in energy content of the system. With 95% of the heat capacity of the climate system in the oceans, changes in sea level are a very good indicator of long term changes in temperature. Like the mercury in a thermometer the oceans expand with warming and contract with cooling.
My calculation used the same principle.. As Paul Dennis mentioned Shavis and others use this as the basis for ocean calorimetry.
Of course it is rather more complex than just thermal expansion. A warmer climate has smaller icecaps, with a greater proportion of the planet's water in the oceans and less land ice.
Compare the Holocene with the previous glaciation. We have land ice mostly in Antarctica and Greenland. The earlier glacial period had ice cover down to 50N latitude. My home in Northern Ireland was under an estimated 5000ft of ice .
That ice came from snowfall and the water came from the oceans. The sea levels were 120 metres lower.
Temperatures were about 5C cooler than today.
Go the other way, into the pre-Ice period more than 2 million years ago. The configuration of the continents allows free ocean circulation across the North Pole, so no ice forms in the Arctic lands. The sea levels were up to 60M higher than today and temperatures were about 5C higher.
Radiative imbalance(either way) is not new, nor is sea level change. Both are a response to climate forcing and occur during any transition from one climate equilibrium to another.
 Entropic man
EM, a new ice age seems more troublesome. No wonder that was the previous scare story.
Was it the industrial revolution that ended the Little Ice Age?
golf charlie
EM
"Radiative imbalance(either way) is not new, nor is sea level change. Both are a response to climate forcing and occur during any transition from one climate equilibrium to another."
Since the mid Pleistocene revolution the global climate has alternated between two states; a cold state with extensive continental ice caps in the northern hemisphere and Patagonia , a dry dusty atmosphere with strong winds peripheral to the ice caps , extensive and rapid loess deposition, great expansion of deserts and low atmospheric CO2 concentrations, and low sea levels, which episodes have lasted generally around 60-80,000years with frequent periodic warmings ( Heinrich events and D-O cycles), and a warm state without continental ice caps , except in Greenland and Antarctica, with a clear, moist atmosphere, weaker trade wind belts, loess erosion, contraction of deserts, high sea levels, expansion of mega lakes and inland seas ( Caspian, Aral, Chad, Lahontan etc), and high atmospheric CO2 concentrations, which states have generally lasted 10- 20,000 years
. At the end of the cold episodes outgoing long wave radiation is probably exceeded by insolation while at the end of the warm periods outgoing long wave radiation probably exceeds insolation. The power spectra of variations in planktonic dO18 at 100,000, 41,000 and 23,000 ( Imbrie et al 1984) years matches well with the periodicities of the three major Milankovic cycles but the role played by them in an immensely complex series of interrelated systems in the solar system, the atmosphere, the oceans and the land means that it is most unlikely that any simple hypothesis or model of climatic change would have great or wide applicability.
Paleoclimate Buff
EM (10:26 PM) Thank you for that.
My general impression is that sea level data is dodgy in the extreme. For the recent past, (a bit like temperature data from tree proxies), trying to estimate very small trends, with roughly-done measurements taken in the presence of waves and tides and very few reference points that have been in place for a couple of centuries. With the effects of tilting/rising/descending land areas reducing whatever precision might otherwise have be obtainable.
As soon as you try to estimate sea level rises prior to recordings, you are really entering the "informed guesswork" zone of proxy measurements whose limitations have been described clearly earlier in this thread.
A bit earlier, you said...
Over the last 20,000 years there has been a net uptake as the Holocene warmed, then 5000 years of stable temperature and no imbalance. There was then 5000 years of cooling and net energy loss into the 1800s.Finally temperatures are rising and the imbalance is favouring heat uptake again.
You sound (and I am sure you are) very certain about that but to me you are working from data that is really no more than a combination of best guesses. (And guesses which contradict information from fields such as archeology.)
"..5000 years cooling and net energy loss into the 1800s.Finally temperatures are rising ..."
That got me curious about what data from actual measurements shows. So far as I know, the earliest measured data on temperatures comes from the Hadley Centre Central England Temperature dataset, with montly data going back to 1659.
Averaging the mean temperature for each month from 1659 to 2015 gave January as having the lowest computed mean (3.3°C) and July having the highest (16.0°C).
I plotted the Hadley 'mean monthly temperature' for January and for July. I did a least-square fit to the January and the July data, with the results shown here (graph).
The "rate of warming" (slope of the fitted line) that I computed was as follows:
January data from 1659 to 2015: Trend computed as 0.48°C per century
July data from 1659 to 2015: Trend computed as 0.14°C per century
Looking at the graph, a couple of things seem interesting to me:
- You might say that it's buried in the variability but I can see little or no confirmation of your "...5000 years cooling and net energy loss into the 1800s" (at least since 1659 in England)
- There have been a few unusually warm Julys since 1970. But, from the graph, the same thing could have equally well have been said in March 1816 about the Julys since 1770.
Martin A
EM... you quote me as writing:-
Over the last 20,000 years there has been a net uptake as the Holocene warmed, then 5000 years of stable temperature and no imbalance. There was then 5000 years of cooling and net energy loss into the 1800s.Finally temperatures are rising and the imbalance is favouring heat uptake again.
I have previously made 5 contributions to this debate and in none of them did I write that.
Paleoclimate Buff
Paleoclimate,
I posted the comment above your 5:51 comment. In it, I was quoting what EM himself said.
Martin A
EM - Apologies - got the wrong end of the stick!
Paleoclimate Buff
Martin A, Clive Best recently did an analysis of CET and found that the only discernible upward trend was in Winter. It seems that you have confirmed that.
diogenes
diogenes - thanks for pointing that out.
I see that Clive Best noticed, as I did, that the year-to-year variability of the winter temperatures is greater than that of the summer teperatures. I found that the standard deviation of the January temperatures from the trend (~1.9°C) was about twice that of the July temperatures (~1.1°C).
Martin A
michael hart - it's too bad that BH does not have a usable search facility. Some time back I asked pretty much the same question and EM replied. I can't remember his exact words but it was along the lines that we know there is a radiative imbalance, because the sea is getting warmer.[..]
Mar 24, 2016 at 8:24 PM | Registered CommenterMartin A
MartinA, I generally try to keep a text record of comments I post. By using selected phrases this has, in the past, allowed me to relocate a goodly amount of my BH posts on the internet by using the Google "search-site" function. It doesn't seem to work as well lately (not all Google changes are positive, and they can't index everything), but is still probably still worth a try.
However, I don't need help from Google to know that I have told Entropic Man before (more than once) that he cannot make valid calculations about thermal ocean-expansion because he doesn't know where the heat has gone and the coefficient of expansion varies strongly with the temperature of the water being warmed.
As I've said to him before, to no avail, Trenberth probably invoked the ocean abyss because he knows of the uncertainties there that he can use to his advantage when hiding his missing heat. But when he gets there, he will apparently meet Entropic Man who knew all the answers all along and described it all in his treatise of 'A'-Level assumptions, calculations, and guestimations, which he then appears to believe is something called "evidence".
michael hart
Martin A, paleoclimate buff
Can you try a polynomial fit for those CET graphs?
A linear fit deprives golf Charlie of the Little Ice Age.
Your result is not a surprise. Modern data shows the same pattern. Winters are warming faster than Summers.
Is there a double standard here? Consider Don Easterbrook and Christopher Monkton with their misleading graphs labelled Minoan Warm Period, Roman Warm Period and Mdeieval Warm Period , all based on a misrepresentation of Richard Alley's GISP2 data. This is a single ice core from Greenland, not global data.
You claim that the paleo data is too uncertain to give a useful useful temperature plot automatically invalidates Easterbrook and Monkton. Climate scepticism cannot have it both ways.
Entropic man
So EM, have you changed your argument?
diogenes
Paleoclimate buff
No problem. I also find it difficult to keep track!
Entropic man
Diogenes
So EM, have you changed your argument?
In what way?
If you refer to my Easterbrook/ Monkton comment, I am pointing out
a) that their graphs misinterpret GISP2.
b) that climate sceptics can play the " uncertainty" card OR the "the past was warmer" card. Since they contradict each other you cannot play both.
My opinion? Properly used, one can get useful temperature profiles from paleo data.
Goodnight
Entropic man
Winters are warming faster than Summers.
Is there any downside to milder winters? Milder winters sound like a good deal to me. If global warming climate change means winters will be milder but summers won't change much, how is that going to equate to 'catastrophic'? I don't get it.
Can you try a polynomial fit for those CET graphs?
In principle yes. But is there any reason to think that its coefficients would have any meaning whatever? My eyes tell me that there is nothing there but random variation with some mean value and a trend whose slope itself probably has a very significant random element.
What order polynomial would you like? A polynomial of order 2015-1659 = 356 could in principle be found to fit precisely through every single data point but its coefficients would tell you no more than the raw data.
Fitting polynomials makes sense if you have a priori reason to believe that the underlying process is well modelled by a polynomial. But it is not a good way to extract information where you have essentially no knowledge of what is going on - or where you think you do have some knowledge but it is not described by a polynomial.
Climate scepticism cannot have it both ways.
Mar 27, 2016 at 11:11 PM | Unregistered CommenterEntropic man
EM - You are evidently enamoured of your vision of two alternative religions.
This fits with the viewpoint that you have expressed a number of times that you will believe in one scientific theory, no matter how it fails, until a better one comes along.
And it confirms that CAGW belief is akin to a religion in many ways.
But it does not work like that. Any more than, when a couple of God botherers come to my front door, I have to accept the nonsense they tell me about a supernatural being unless I can come up with a more powerful alternative deity.
If I find 'climate science' entirely unconvincing* , this in no way means that I automatically endorse anything and everything that is brought up that disagrees with the climate science mainstream.
... that climate sceptics can play the " uncertainty" card OR the "the past was warmer" card. Since they contradict each other you cannot play both.
Why not? If it is not certain which one is correct, both can be put on the table as two alternative (even if exclusive) hypotheses.
______________________________________________________________________________________________
* With its use of the output unvalidated GCMs as 'evidence', with its proxy reconstructions which fail basic checks, with its rubbish explanations of the greenhouse effect, with its appeal to logical fallacies - "we don't know what else could explain it, which proves it"(© Met Orifice).
Martin A
EM,
why a polynomial fit? That would not be a very sensible thing to do. I think you probably mean some form of moving average/LOESS type fit to see if one can tease out a pattern in the data. The most striking feature of the data set is that the year to year variability is considerably greater than the temperature changes associate with the trend over the period of the record.
This brings me to the second point. I'm no more interested in what Easterbrook or Monckton have said than I am with Hansen's latest polemic. However, the Greenland Ice sheet isotope record is (i) our most complete northern hemisphere record, and (ii) also the record that we have an opportunity to relate most directly to temperature. This is because the isotope composition of the precipitation is a function of the temperature difference between the source region for water vapour and the site of precipitation. One doesn't need complex models to verfiy this and can determine the nature of the relationship from the Clausius-Clapeyron equation for the water liquid-vapour, and ice-vapour phase boundaries and the liquid-vapour and ice-vapour fractionation factors. The source region is the sub-tropical north Atlantic. The temperature differences recorded by the ice composiition likely to be dominated by temperature changes in Greenland and not the sub-tropics. We should look at the deuterium excess record (that is deuterium excess = 8 x d18O minus dD) to better understand processes in the source region.
Given this it is likely that the Greenland ice sheet record, whilst not representing a global record does give a strong indication as to the nature and frequency of climate fluctuations in the north-west European context. If it doesn't then we'd have to see some pretty dramatic changes in patterns of atmospheric circulation etc. throughout the Holocene compared to the modern period. So we're left with a record that shows large excursions in temperature on time scales comparable with the modern period superposed on a general cooling pattern.
Even updating the record shows that the modern temperatures in Greenland still do not match those of earlier times in the Holocene.
I think we all agree that properly used at a local scale one can derive useful information about temperature. It is the multi-proxy studies that are the issue. Because of the nature of the chronologies and their temporal resolution we lose a considerable amount of information about the structure of climate variability (periods of excursion and amplitude) on time scales as long as centennial to multi-centennial behaviour. This is well recognised by, for example, Marcott et al. aTTP has made an argument that not all the signal is lost. I agree but, for example, look for the 8.2ka event (represented in proxies world wide and especially strong in the northern hemisphere as a short duration negative temperature excursion) in the Marcott record and it is barely, if at all, represented.
So we are left with perhaps the best proxy record in Greenland as demonstrating that at the local scale, and perhaps the regional scale, significant climate fluctuations have occurred throughout the Holocene. Interpreting these is another matter. The early features, including the 8.2ka event are likely to be related dynamics associated with the retreat of northern ice sheets and release of significant amounts of melt-water. However the latter part of the Holocene, say the past 5 to 6 thousand years is more difficult to understand.
These short term (decadal to centennial) climate fluctuations are also seen in other proxy records throughout north-west Europe e.g. Lake Amersee in southern Germany, caves in Austria. Most correlate with those in Greenland. Thus there is some confidence in suggesting the rapid climate fluctuations picked up in the Greenland ice sheet are representative.
On a millenial time scale there is some 'drift' between the Greenland and European records.
I would argue that the Greenland record is more representative of regional climate than, for example Bristlecone Pines or a few trees in Yamal are of global climate.
Paul Dennis
Martin A
I offer support for your last point. Geological evidence commonly is insufficient to reach definitive answers (hence this entire thread). Not all the critical evidence required to make determinative conclusions may be preseved. Accordingly geologists may hold to several hypotheses simultaneously to explain the same set of facts. This methodology was first formulated by T.C.. Chamberlin in 1889 (published in 1890) as "The Method of Multiple Working Hypotheses". Knowledge of this seems largely confined to geology, but clearly reflection suggests it is in operation in the cutting edge of most sciences. Clearly not practiced by computer modellers, however.
Chamberlin's methodology ought to be force fed to all climate scientists.
Alan Kendall
Paul,
One issue with how the Greenland ice core data is presented publicly on blogs is that it is often presented as if before present means before now, rather than before 1955. My understanding is that if you do the comparison correctly (i.e., using the correct BP date) that even the Greenland ice core data shows that the modern warming is pretty unprecedented. Again, I'm not an expert at this.
...and Then There's Physics
and then there's physics,
difficult to support view that present-day warmth is unprecedented because MISS 5e dated (= Last Interglacial) raised beaches lie several metres (commonly +5m in the UK) above present-day sea level. If sea level responds to overall global warmth (ie ocean temperature plus amount of continental ice), the raised beaches indicate warmer global temperatures occurred then. This conclusion supported by molluscan faunas within raised beach deposits which, in the northern hemisphere, commonly include more southerly (ie warmer water) species.
In addition, many different lines of evidence indicate the Holocene Optimum was decidedly warmer than today.
Alan Kendall
aTTP,
I think the ice core record might terminate as far back as 1855. However, I was comparing modern temperature measurements with the ice core record. This is not necessarily a good comparison because there is still debate as to how the isotope record is best transposed into a temperature record. If one takes a modern time slice and determines the temperature-d18O relationship from areally distributed data one gets a gradient of about 0.7 per mille d18O per degree C. This is exactly what one would predic from thermodynamics. If, however, one takes a record from one site and determines the temperature-d18O realtionship then the gradient is often much lower. This is true on time scales of seasonal variation to glacial-interglacial transitions. It is seen in ice core and other freshwater archives. In groundwaters one can use noble gas mixing ratios to determine recharge temperatures. Glacial-interglacial temperatures transitions, e.g. in the UK typically come out at 5 degrees C or so. Yet the 18O isotope shift is only on the order of 2 per mille. Part of this can be accounted for by the increased d18O of the ocean but not all. Clearly the thermodynamic characteristics of the water system don't change so one must infer different characteristics of the water cycle - different source region temperatures, humidities, air circulation patterns etc.
Despite my assertion that the ice core record is the best we have it isn't fully understood.
I think that's a round about way of saying that the modern temperatures are commensurate with those of estimated maxima associated with fluctuations of the past. Whether they are warmer or not I couldn't say. I'm always wary about claims of 'unprecedented'. I stick by my comparable statement above. It will be interesting to see how things evolve over the next few decades.
Paul Dennis
aTTP,
sorry I forgot to add this. I agree the public presentation of data as years bp is wrong. If Monckton and Easterbrook are doing this then it is a mistake - either deliberate or through lack of understanding of the proxies. Some should know better.
Paul Dennis
Paul,
That's fair enough. When I said "pretty unprecedented" I meant that I think a proper analysis indicates that we could be as warm now as the warmest its been during the Holocene, and that the rate at which it has warmed has probably been faster than at any other time during the Holocene. Again, I haven't checked this thoroughly. As a physicist, if we continue to emit CO2 into the atmosphere, I would be extremely surprised if we didn't continue to warm :-)
...and Then There's Physics
I have to admit, it is getting difficult to endure the pompous arrogance that can state things such as:
I tend to see it as obvious.(Translation: you are obviously too think to see this.) Or:
Properly used, one can get useful temperature profiles from paleo data.(Translation: I am so smart, I am the only person who can use the data properly; stuff you, Kendall and Dennis.)
Let us look at what Dame Julia Slingo has revealed (to Mehdi Hasan, HuffPo, 11th Feb 2014):
We have endured, the Met Office's chief scientist revealed on Sunday, the "most exceptional period of rainfall" for nearly 250 years.[My bolding] So, it has happened before – and at a time when it is commonly acknowledged that temperatures were considerably cooler than the present. If that is so, then why is it assumed that what has happened recently has to be caused by warming?
With such contradictory arguments being presented continuously by the Believers, it is getting rather tiresome; at least the sceptics are consistent with their scepticism.
Radical Rodent
So, it has happened before
Doesn't follow. Do we have records that go back more than 250 years?
...and Then There's Physics
From the archives
EM and the precision of ocean heat estimates from ARGOS floats