


Discussion > Are Geological Paleo-Climate Records Relevant to The Climate Debate?
Michael hart
This is why you are losing the public debate.
We give you evidence and all you can manage is weak sarcasm
 Entropic man
EM - mh was obviously referring to his 6:18 comment and how your 7:26 comment was perfectly in line with that.
Martin A
EM,
I don't dispute that the heat content of the oceans is rising however your estimate of 3x10^22 J.a^-1 seems to be at the high end of estimates. Since about 1990 NOAA reports an increase of about 0.7x10^22J.a^-1 for the upper 2000m of the ocean. I don't think there has been much gain in the deep ocean. Most of it hasn't been near the surface for hundreds to thousands of years. 0.7x10^22J is also more consistent with thermal expansion estimates. By my rough calculation your figure would result in expansion of 3mm.a^-1 and not allow any room for meltwater inputs etc.
For me the key issue is that a significant fraction of this could be driven by natural phenomena plus an anthropogenic component. This anthropogenic component could lie somewhere between 30 and 50% and would be consistent with the growing trend for estimates of climate sensitivity to fall at the lowest margin of IPCC estimates.
This is not tangential to the topic of this discussion. I think we are all now in agreement that the proxy record cannot determine the structure of past natural climate variability at an appropriate centennial wavelength . I hope that you can also agree this now. Thus we are not in any position to state that the present climate fluctuation is beyond the range of 'natural' variability. As before my use of the word 'natural' is deliberate and does not exclude other external drivers of the climate.
Whatever your position surely you can see the importance of following all avenues of research to try and understand the system and the nature of the forcing. This includes experiments such as CLOUD and the ongoing work of Svensmark, Shaviv and others. We should be encouraging a diversity of research and not be dismissive.
It is unfortunate that in the current political 'climate' (no pun intended) surrounding climate change it is becoming increasingly difficult to secure support for research which attempts to define the limits of our knowledge and investigate new ideas. I know this from personal experience. Both from my own research grant applications and from reviewing the applications and papers of others. There is an intolerance of diverse ideas even though some of these are based on sound science.
Paul Dennis
Martin A
The atmosphere and ocean surface are warming at 0.16C/decade.
Ocean heat content is increasing by 3*10^22Joules/year.
Ice melt from Greenland and Antarctica is 400 cubic kilometres per year.
Sea level is rising by 3.3mm/year of which 40% is thermal expansion.All of these processes require energy to be absorbed by the system. If it was in balance the energy content of the system would be constant, and, apart from internal energy exchanges, so would these.
Mar 24, 2016 at 6:53 PM | Unregistered CommenterEntropic man
Thanks for that EM. I remember that you said something similar not too long ago.
Ironically, a couple of hours before you left your comment, I was typing the following but Firefux crashed and I so left it and went for a walk before dusk fell. Here, from memory, is what I typed:
_____________________________________________________________________________
Obviously that's a bit of a bummer for the CO2 IR-catastrophists, but it has never stopped Entropic Man from making sweeping claims about the net earth radiation budget.
Mar 24, 2016 at 6:18 PM michael hart
michael hart - it's too bad that BH does not have a usable search facility. Some time back I asked pretty much the same question and EM replied. I can't remember his exact words but it was along the lines that we know there is a radiative imbalance, because the sea is getting warmer.
After pointing out that the radiative imbalance is used to calculate how much things are warming up, so it's all a bit circular, EM told me that this is "successive approximation - a standard method for iteratively increasing accuracy" (or words similar to those).
I think I replied that successive approximation is a great way to solve equations numerically - Newton's iteration always impressed me with the speed of its convergence.
But to use an estimate of a physical quantity to make an estimate another physical quantity, and then to use that result to 'improve' the first estimate, and so on, and so on, will no doubt converge to something or other. But what the relation is, between what it finally converges to and reality, seems entirely moot. I don't think I made the point well enough for EM to be convinced by (or even understand) what I was saying.
Martin A
Martin A,
you are absolutely right. One can use a measurement of a physical property to estimate a second property. However, one should then, never, use this estimate to refine the first measurement. EM's calculations only have validity if his figures for heat content, sea level rise or what ever are truly independent measurements. I assumed they were but now am worried that he is using some form of circular calculation to close the gap between estimates of the energy imbalance.
Paul Dennis
Paul Dennis,
Climate science has a number of features not normally found elsewhere in science - at least the sort of science I have come into contact with. One of its apparently unique features is the tolerance of circular reasoning.
A key example is the use of general circulation climate models, where the models are built and parameter values set based knowledge gained from analysis of observed climate data. The models are then 'validated' by confirming that they more or less reproduce past climate history - including the period from which the observations used to build/parameterise the model were recorded.
In other fields this is referred to as 'testing on the training data' and has been recognised for many decades now, as giving a falsely rosy view of the capability of the model being evaluated. Yet the Met Office (for example) states apparently with a straight face...
Computer models are the only reliable way to predict changes in climate. Their reliability is tested by seeing if they are able to reproduce the past climate, which gives scientists confidence that they can also predict the future.
Martin A
EM, where along the South Coast of England am I most likely to be able to see 3.3mm of sea level rise a year, and when did it suddenly accelerate?
Has anyone told the tourist industry in the Maldives, as they are spending a lot of money?
One day I am going to have to visit Winchelsea in Kent with a Surveyors Level, to work out when it may again become a bustling harbour town.
golf charlie
The Flandrian Transgression resulting from the melting of the Laurentian and Fennoscandian ice sheets, with probable increment from reducing ice volume in Greenland, the Antarctic and from mountain glaciers ,amounted to a sea level rise of 120 m over a period of 18,000 years for an average of 6.7 mm year. However between 12,000 and 5,000 years ago the rise was 90 meters for an average of 12.9 mm year, while in the last 7,000 years the rise has been 20 meters for an average 2.9 mm per year. A current rate of 3 mm per year is thus not significantly different from the average rate over a much of the Holocene. It also needs to be born in mind that sea levels probably fell close to 2 meters from its high stand 2,000 years ago at which time the Isle of Sheppey was indeed an island and there was a navigable channel from Pegwell Bay into the Thames to the west of the North Foreland and inland urban centres such as Winchelsea, Rye and Dimchurch were important ports. There was also a navigable chnnel to Fordham - almost in the outskirts of Canterbury. and inlets such as Chichester, Langstone and Portsmouth Harbour were more extensive than at present as evidenced by early marine charts.
There is nothing unusual about present rates of sea level change of +/- 3m,m per year in a Holocene context .
Paleoclimate Buff
The atmosphere and ocean surface are warming at 0.16C/decade. [1]Figures you keep throwing at us without a shred of evidence, and in contradiction of what many agencies acknowledge.Ocean heat content is increasing by 3*10^22Joules/year. [2]
Ice melt from Greenland and Antarctica is 400 cubic kilometres per year. [3]
Sea level is rising by 3.3mm/year of which 40% is thermal expansion. [4]
[1] Even NOAA, NASA and the UKMO accept that there has been no significant warming for nearly 20 years.
[2] As we have been monitoring a small proportion of over 1 billion cubic kilometres of sea-water with any intensity for just a few decades, how can you be so confident that the heat content is increasing at such a rate?
[3] NASA has acknowledged that the ice over Antarctica is increasing; where do you get the information that contradicts them?
[4] Again, a questionable figure for which there is no evidence – least of all your assertion that 40% of it is from thermal expansion, when there are so many alternatives that could be influential in sea-level change!
Yet again, you give us information that makes many wonder which planet you are actually talking about, EM. It is getting rather embarrassing. Please don’t bother asking for evidence – it has been given to you many, many times, but your Morton’s Demon is a hard-working little rascal.
Radical Rodent
Paleoclimate Buff, thank you for the clarification about 3mm and further detail especially in connection with the south coast, some of which I am familar with and visit regularly. Having been raised and educated on the Cinque Ports Silting Up, I never gave it much more thought. When I did, 15? years ago, I wondered whether the silting up was due to reduced rainfall. Then I thought about it again!
The high stand you mention about 2,000 years ago, also helps make sense of the location of some Roman sites in southern England
I have never had an issue with variable sea level, through visual evidence, history and archaeology, nor the gradual rise currently observed. It is the claims for specific areas, ignoring those nearby with non matching data, that appear to be deliberately chosen to exaggerate the scale
The Launch Ramps for Mulberry Harbours were only designed to be used in 1943/4, but they do not seem overwhelmed by high tides 70+ years on.
I know some of the U-Boat Pens built in France are still in existence, though I have never seen them, but I wonder what story they might tell. I have learnt to respect the quality of German engineering, as did the RAF crews who tried to destroy it.
On the Dalmatian Coast, I have been into a single U-Boat Pen tunneled into rock, with sea gates fitted with wire netting to take further camoulflage. The sea gates even had a cut out for the conning tower and horizontal fins. Only accessible by boat, it was not on the normal tourist trail!
golf charlie
golf Charlie
In the late 1950s earliest 1960s much effort waz expended on determining the vertical range of littoral species relative to tidal position and also to the degree of shoreline exposure (publications available online in Field Studies Journal). If sea level has risen by 3.3mm/yr, then the biotic zones established then should have risen more than 20cm (plus or minus effects of subsidence or land rising). If photographs taken at that time can be located and compared with the present day, any change should easily be recognized and measured (upper barnacle line would be an obvious target). Even photographs of loved ones draping barnacle-encrusted pier support struts would suffice.
Possible complications include effects of gradual tidal range changes (don't remember rate or magnitude of these; likely to be minimal?) and changes in storm frequency and intensity. But then nothing in science is really easy. My belief is that the more difficult the problem, the richer the haul when you solve it.
Suggest this might be a more profitable line of attack than examining old submarine pens!
Alan Kendall
Paul,
If you ever find yourself in the vicinity of East Anglia please feel free to call by my lab and see some of the work we are doing with new isotopic proxies for temperature.
Thanks, if I'm in the area, I'll do that. If you're ever in my area, feel free to drop by.
I realise that there are various comments aimed at me, but I think I've been through this before, so will pass this time.
...and Then There's Physics
golf Charlie March 24, 10.05pm.
re your reference to the Maldives:
Much concern in those blessed isles but also area of huge denial. Classic case of mangrove tree inappropriately located (demonstrating lack of any sea level rise). Reputedly rooted up by Australian activists to remove such inconvenient truth. All in vain because documentary photographs remain as testimony of sea level stability and eco-vandalism.
Refused permission to study there in 1994/5 by Maldives Government. Suggested topic still not published upon. Many, many regrets.
Alan Kendall
Martin A,
thank you for that description. I think aTTP's point is subtle and likely still comes under signal processing. Instead of point sampling a signal at a particular sampling frequency one is averaging the signal into boxes with a width of the sampling wavelength. Intuitively this might contain some more information than single point sampling but my sense is the signal will be strongly attenuated and we will have no knowledge of it's correct frequency and amplitude. I also think it will be buried in the measurement noise.
Mar 24, 2016 at 1:30 PM | Unregistered CommenterPaul Dennis
Paul,
That amounts to putting the signal into a so called boxcar filter (its impulse response is a rectangle of duration equal to the sampling frequency) prior to sampling.
It is a sensible thing to do. It attenuates, though not completely, components of signal and noise above half the sampling frequency, so reducing the effect of so-called aliasing, where high frequency components of signal or noise show up, after sampling, as low frequency spurious rubbish.
It also attenuates the signal by about 3dB at half the sampling frequency but it has negligible effect on signal components at frequencies low compared with half the sampling frequency.
Thus the averaged/sampled signal contains no more information about the wanted signal than the sampled-with-no-averaging signal. But it contains somewhat less spurious rubbish.
Martin A
Martin A,
once again for the very clear explanation. So a sampling interval of 300 years will attenuate by 3dB a signal with a wavelength of 600 years. A climate excursion of 100 to 200 years, a frequency that is twice that of the sampling frequency would be heavily attenuated. I don't think this is controversial and Marcott and co-workers state they have significant attenuation in their multi-proxy study.
Paul Dennis
Paul Dennis
I have a habit which infuriates the folks here. I like to make back of the envelope calculations to check other people's climate figures.
NASA base their imbalance calculation increase in ocean heat content on temperature measurements to 2000M.
I used thermal expansion. Various sources quote estimated contribution of different sources to sea level rise. When you subtract ice sheet and glacial melt, pumping from aquifers, etc the residue is a rise of 1.4mm/year due to thermal expansion. You can then calculate the required average temperature rise and the energy required to produce that warming .
You can then divide through by the surface area of the Earth to get the energy imbalance.
IIRC the calculation went something like this.
Surface area of the Earth 5.1*10^8 km^2 , 5.1*10^14M
Surface area of oceans 3.6*10^8 km2 , 3.6*10^14 M^2
Volume of oceans 1.37*10^9 km^3 , 1.37*10^21L
Thermal expansion coefficient for seawater 1.8 × 10^−4K^− 1 at 2000M
Specific heat capacity for seawater 3985 J kg−1 K−1
To increase sea level by 1.4mm requires a volume increase of
1.4 * 3.6*10^8/10^6 = 504 km^3
Expansion ratio is 1.37*10^9 + 5.04*10^2 /1.37*10^0 =1.00000037
Average temperature change is 3.7*10-7/1.8*10^-4= 6.7*10-3K
Energy imbalance is 1.37*10^21 * 3.985*10^3 * 6.7*10^-3 = 3.7*10^22J/year.
There are a couple of approximations. The biggest uncertainty is the thermal expansion coefficient, which varies with pressure. I picked a value roughly corresponding to 2000M depth.
Energy imbalance per square metre per year is 3.7*10^22/5.1*10^14 = 7.3*10^7J
1 Watt is 1 Jou!e second.
Th imbalance becomes 7.3*10^7 / 3.15 *10^7 = 2.3W M^-1 year^-1
The surface imbalance estimates centre around 0.7W and the satellite estimates around 4.2W. A simple back of the envelope calculation gives a similar value, which give me confidence in the published data.
Entropic man
EM,
your estimate of the ocean energy uptake is based on your, or others estimate of the steric component of sea level rise. You get a figure for the energy uptake by the ocean that is 3x greater than that estimates using temperature measurements to 2000m. There's a mismatch here that is worth exploring. Perhaps the temperature measurements don't have sufficient coverage. Perhaps the bulk of the heat is in the upper few hundred metres and a different coefficient of volume expansion is needed. Perhaps the estimate of ice melt, precipitation, run-off, groundwater storage etc. are wrong. Each o fhse has considerable scope for error.
Isn't it the case that the errors on the satellite estimates are such that any imbalance could be either positive or negative. They are trying to identify a small difference between two large numbers to a precision that is something like 0.1% or better.
I applaud your approach but wouldn't put as much weight as you do on the coincidence between values because of the very large error bounds. There is information in the difference between the approaches that could be telling us something about the system and ultimately what the external drivers are.
Have you read the ocean as a calorimeter papers by Shaviv?
Paul Dennis
So a sampling interval of 300 years will attenuate by 3dB a signal with a wavelength of 600 years. A climate excursion of 100 to 200 years, a frequency that is twice that of the sampling frequency would be heavily attenuated. I don't think this is controversial and Marcott and co-workers state they have significant attenuation in their multi-proxy study.
The frequency characteristic of the 'boxcar' filter is a sin(πx)/(πx) function ( graph) and has infinite attenuation at the sampling frequency (and at integer multiples of the sampling frequency) but the attenuation falls off relatively slowly with frequency otherwise. But despite that, it makes good sense to use it to reduce the unwanted effects of aliasing of high frequency components by the sampling process.
 Martin A
Martin A,
I've got it! Thanks.
Paul Dennis
Radical rodent
1) You mention significance. The uncertainty in the GISS temperature data, the 95% confidence limits, are +/- 0.09C. A quick rul of thumb is that there is a significant difference between two annual temperatures when their 95% confidence limits no longer overlap. That corresponds to a temperature difference of 0.18C.
Now consider the 1997/1998 and 2015/2016 El Ninos.
The GISS monthly data show the 1997/1998 El Nino peaking in February 1998 at anomaly 0.88C The corresponding peak in February 2016 was 1.35C.
The distance between the two corresponding peaks 18 years apart is 0.47C, way above the 0.18C significance threshold. Any pause related arguments are now obsolete. Depending on your definition, there may have been a pause. Only if you were innumerate or in denial would you seriously claim that any pause continues.
2) The volume of the oceans is 1.37 billion cubic kilometres.
Ignoring floating buoy and ship measurements, there are 3500 ARGO floats sample between the surface and 2000M, taking 200 measurements in each 10 day cycle.
That is 25.5 million data points per year, one for every 54 cubic kilometres. Perhaps you can show me the calculations which tell you that this is an inadequate sampling rate, and what a sufficient sampling rate might be.
My own calculation, in my post this morning, derives an overall temperature rise of 6.7*10^-3C from thermal expansion, independent of individual temperature measurements.
3) You oversimplify. One paper, Zwally et al, suggests a net increase of 265 billion tons/year based on altimetry measuring ice volume. GRACE data shows an ice loss of 248 billion tons/year.
Since both cannot be right, a crosscheck is needed. If you add up all the other contributions to sea level rise, the residue fits the GRACE data. If Zwally is correct, there is another 248 cubic kilometres of water/year coming from another unknown source.
4) This summarises the main contributions to a level rise.
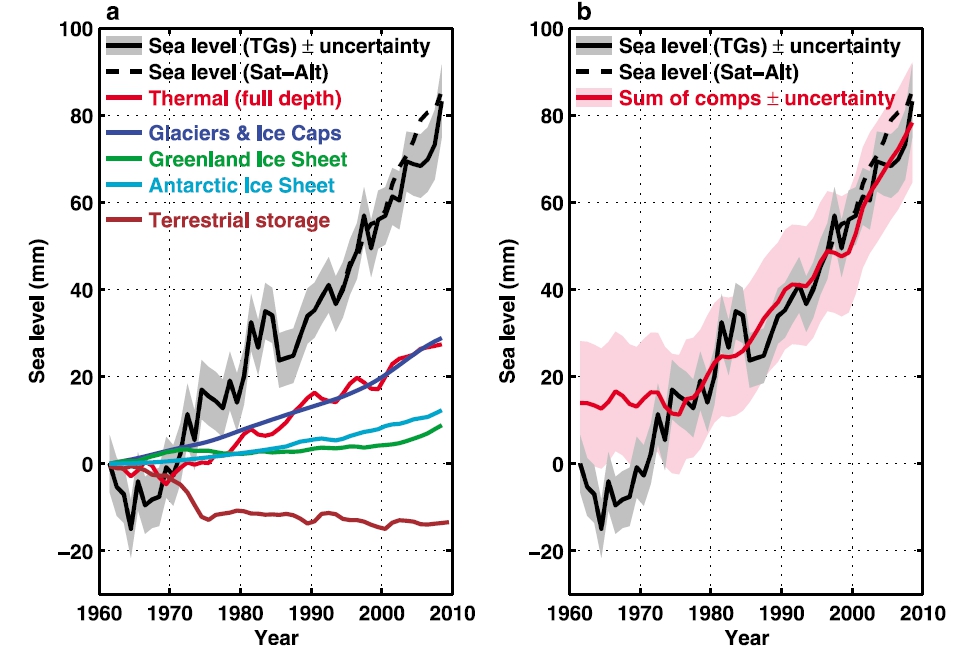 Entropic man
EM
I'm not the world's greatest mathematician but it seems from your link that sea level rise over the last 50 years has been around 1.6mm a year which is not going to get me panicking!
Your other big scary number is just that. The Argo buoys may well each be taking 7,300 readings a year but what does that tell us? With 3,500 of them to cover 360,000,000 square kilometres of ocean that works out at 1 for every 102,857 square kilometres. Colour me unimpressed!
Mike Jackson
Interesting logic, EM: so, what you are saying is that, for the 130,400sq.km. of England, all I need to do is take thermometer readings in my back garden every 10 minutes, which will then equate to one reading per 2.5sq.km. thus allowing me to make equally ridiculous assumptions that you are making. Other simple facts I like to observe – such as, when looking at picture postcards of, say, pre-war Blackpool, the sea-level looks much the same as it does today; indeed, there are some places where the sea-level appears to be significantly lower than it was in times past (see Golf Charlie’s posts, above). Other observation: one of my childhood homes, in a totally different part of the world, was close to the sea; seeing it in recent photos shows that there is little difference in the sea levels in the 50 years since I was last there – the rock pools where I used to swim when the tide was out are still surrounded by drying outcrops. Surely, a 6 inch rise should have made some discernible difference? Even the 3.5 inches as suggested in those graphs should have some observable difference. Nils-Axel Morner, who has spent a large part of his career studying these things, admits that more data is required, but his own conclusions are that there is little change in sea-levels, and that they might actually be going down. Much as you seem to desire a cataclysm, I doubt you will see your dream realised.
Should the temperatures have started to rise, I welcome them, as they have brought us huge benefits since the Little Ice Age, a process that is likely to continue. What I do dread is a reduction in temperatures, as that would bring us closer to a cataclysm than any rise would.
Radical Rodent
EM - I am missing a point.
I asked about radiative imbalance. You answered with figures derived from sea-level rise.
So, if radiative imbalance is a new thing, does this mean that sea level rise is a new thing too?
Or, to put it the other way around, if sea level rise has been going on for a long time, doesn't that mean we have been living with radiative imbalance for a long time too?
Martin A
RR
As I have pointed out before, I can get a different reading by moving the sensor on my thermometer from one end of the scullery windowsill to the other.
The temperature in the middle of the garden varies from 15° above my "official" record to 10° below depending on the time of day/year. I get 52 max readings and 52 min readings a year none of which is the same as the "official official" figures for either Besançon or Dijon which are Accuweather's closest reference points.
All quite irrelevant to anyone except me but (I would respectfully submit, m'lud) as useful as one Argo buoy bobbing up and down in its 102000 sq km of sea.
There will come a day when all these measurements we are all taking might be if some use and have some meaning by not in my lifetime or EM's I fear.
Mike Jackson
ATTP
The rest is pure waffle but the fact that CO2 levels never once rose before temp throughout any arctic ice core series is all that is needed to debunk all your splutterings.