


 Bishop Hill
 Some oddities in HadSST
Climate: Oceans Climate: Surface 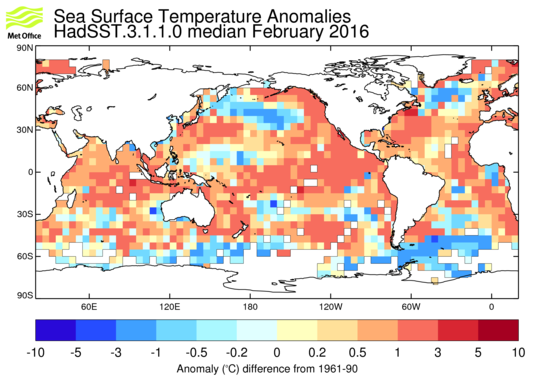 Reader John McLean emails with details of some surprising finds he has made in the Hadley Centre's sea-surface temperature record, HadSST. John is wondering whether others might like to take a look and confirm what he is seeing. Here's what he has found:
1 - Files HadSST3-nh.dat and HadSST3-sh.dat are the wrong way around.
About 35% down web page https://crudata.uea.ac.uk/cru/data/temperature/ there's a section for HadSST3. Click on the 'NH' label and you go to https://crudata.uea.ac.uk/cru/data/temperature/HadSST3-nh.dat, which has 'nh' in the file name. But based on the complete gridded dataset that data file is for the Southern Hemisphere, not the Northern. The two sets are swapped. The links to named files are correct but the content of those files is wrong, likely due to errors in the program that created these summary files from the SST3 gridded data.
2 - The ASCII file containing observation counts per grid cell has records in the wrong order.
On the above page click on the "HadSST3" link and go to the Hadley Centre page, then from there to the "download page" (http://hadobs.metoffice.com/hadsst3/data/download.html) and you'll see mention of an ASCII file of observation counts for each grid cell.
The data in that file is in the wrong sequence. The HadSST3 gridded data has records for each month in sequence from 90N to 90S but the gridded data runs from 90S to 90N.
(I found this when I discovered lots of SST data with no corresponding observation count and then lots of grid cells with observation counts but no SST data. I've created a crude map of cells that contained SST data in January 2000 and it displays with the NH at the top, so it's not the SST data file that's wrong; it's the counts. When I flipped the data in each month into 90N to 90S order the SST data always had corresponding observation counts and there were no cells with an observation count but no data.)
3 - The ASCII observation count file contains unreadable fields because they overflowed.
Since about 2002 it's not unusual to find cells for which the observation count is '*******', meaning that the count is greater than 9999.00. There's no way for the user to know what value should be in that field.
I suspect that problem comes about because the file was written by a Fortran program because that language fills a field with *'s when the data doesn't fit. To use a real number (i.e. with decimal places) makes no sense because one can't make half an observation or 0.19 of an observation. I don't know why the fields can't be a 7 digit integer, but they're not. (Could it be to cater for the language R ?)
(I'm a bit suspicious about the figures in excess of 9999.00 values because that's an average of over 14 observations per hour, or roughly one in less than 4.25 minutes! Probably 75% of cells with these observation counts are along the western or eastern US coast, but the other 25% aren't. Is it a cluster of Argo buoys??)
He adds:
I see from my notes that in 2002 the instances of instances of '*******' in a field were as follows:
2002: 2,
2003: 1,
2004: 5,
2005:14,
2006: 17,
2007: 103
2008: 143,
2009: 178,
2010: 177,
2011: 111,
2012: 127,
2013: 153,
2014: 147,
2015: 136
(or at least that's how the files downloaded after the January 2016 update had things).
This list might help anyone confirm the existence of these overflowed fields.
The HadSST3 observation count problems won't be used by many people, maybe I'm even the first if no-one else has hit the problems. I found them because I was investigating the temperature and coverage impact in each month of grid cells with few observations
I think a fair question is whether Hadley Centre publishes other flawed data on SST or anything else because it looks like there's no in-house verification that software does what it's supposed to do.
Reader Comments (107)
Aww come on Ken, you know that Hansen was making an alarmist statement that he knew would be shouted from the rooftops by a media that loves a good story about armageddon (if it bleeds it leads). Hansen has spent the last 30 years using hyperbolic language in a most unscientific way ("coal trains of death") to whip people such as yourself into a frenzy. Don't try and deny it.
Hi Phi,
Anthony's post clearly states, "Reader John McLean emails with details of some surprising finds he has made in the Hadley Centre’s sea-surface temperature record, HadSST. John is wondering whether others might like to take a look and confirm what he is seeing."
Anthony writing that "John is wondering whether others might take a look and confirm" is far, far different from saying he "wrote his article...as if he was certain the data were wrong."
Obviously Sou is going to be stupid and ignorant. Are you, too?
The crescendo of alarmist screams has peaked and passed, dopplering its train whistle, but the echoes of its frightful passage still echo through the valley of the shadow of fear.
===============================
Surely any sensible scientist who thinks there is no evidence of CO2 doubling in the next 40 years, would refuse to make a prediction based on that premise? In other words, scientists have an especial duty to be extremely careful not to use throwaway alarmist predictions, based on false premises, the significance of which politicians and members of the public may not be able to apprehend.
Budgie,
You said what I was trying to say to Ken. However, you said it more succinctly and more eloquently than I could manage. Thank you
Michael:
AW: 'I wonder what CRU will have to say about this one that has been discovered? '
I am wondering whether Phil or Ken is the Turing test bot, or maybe they are both bots, suffering from defective programming and unable to learn from interactions with humans.
No-one seems to have picked up on the fact that Mosher was talking about a dataset that was different to the one John McLean listed. Curious.
@Harry Passfield
ref the reverse.
if it were a N/S switch, that would put these strange ******** results in the Nevada desert
if it were a full reverse it would put the location on the Afghanistan/Turkmenistan border
neither of which would be expected to produce reliable sea surface temp measurements.
i.e. this is not a simple reverse. There is something massively wonky going on
In other news, the North Pole (row 1 in the data) has zero months with obs
"...As far as Stephen Schneider's quote is concerned, you should read this. However, don't let me stop you from promoting these standard science denial memes. I'd hate to take them away from you; you might have nothing left..."
ATTP, the full-quote and context is little-to-no improvement over the "soundbyte." In fact, it may be even worse, as he adds, "Each of us has to decide what the right balance is between being effective and being honest."
Yes, he concedes that scientists are "ethically bound by the scientific method," as if that's some sort of torture method from the dark ages. But he clearly states that scientists are human beings as well, and human beings are not confined to the scientific method.
How can you possibly defend that drivel and pretend that it doesn't mean exactly what the "skeptic meme" attaches to it? It's plain as day. Even when given the chance to say that he was wrong, Schneider just bemoaned things like his final sentence, "Hopefully it means being both [effective and honest]," being overlooked. Oh wow, that's awesome. He hoped that scientists wouldn't have to rely on lying, but clearly he understood why they might.
aTTP -"Given that it is patently obvious that responding to a question about what would happen if CO2 doubled in 40 years is not the same as predicting that it will, I have no suitable response to your comment."
Could have replied that its not going to double in 40 years so why ask,
Funny Phil...Sou also said, "Of course Anthony didn't bother checking for himself, he wouldn't know how." Why would Sou pretend to know that?
You said, "There will now be a flurry of retracted accusations and associated apologies." Well, as Anthony is prone to doing in such a case, he's updated the post to reflect that the data appears to either have been corrected or was never wrong in the first place. Does this concession count in your world?
Schneider, Hansen...it's amazing how the excuses rain from the heavens about their comments being "taken out of context" so many years later. Just like with the temperature record, the past is always subject to change.
As far as Hansen's quote goes...even if he were answering what would happen if CO2 levels were 560 ppm, the interviewer says he explicitly stated he asked how it would be in "40 years with CO2 doubling" (not the 20 years he later said), which would be 2028. Hansen didn't correct him on that time period.
In any case:
http://www.scientificamerican.com/article/global-warming-beyond-the-co2/
"...Hansen concludes that even if the human race could maintain today’s level of atmospheric CO2, which stands at 385 ppm—not even halfway to the atmospheric doubling we are headed for—sea level would rise several meters thanks to the disintegration of continental ice sheets..."
"Several meters" of sea level rise would put the West Side Highway underwater.
So people want to claim Hansen's comments about the West Side Highway being underwater (and other absurdities) were only applicable in the 560ppm CO2 world. Hansen says it's true in the 385ppm CO2 world as well, so his beliefs/statements aren't tied to a CO2 doubling.
Anthony is prone to doing in such a case, he's updated the post to reflect that the data appears to either have been corrected or was never wrong in the first place. Does this concession count in your world?
The post title is still 'Friday Funny: more upside down data' , so he is still lying.
I notice you still cannot bring yourself to reproduce Schneider's words verbatim and in full, selective quotations seems to be a compulsion around here.
Mount Everest is an interesting case (28 N, 86.5E)
nearly a 100k observations of sea temperature, yet not one observation produced an unadjusted temperature.
The North Pole (row 1) is another interesting case.
Despite have no observations , all of the months with anomalies (all 1150 of them) show a positive anomaly.
I thought the positive anomalies were sort of balanced by the negative ones, around some sort of baseline
Phil, his full quote appears verbatim on the link provided. But just to please you:
"On the one hand, as scientists we are ethically bound to the scientific method. On the other hand, we are not just scientists but human beings as well. To do that we need to get some broad based support, to capture the public’s imagination. That, of course, means getting loads of media coverage. So we have to offer up scary scenarios, make simplified, dramatic statements, and make little mention of any doubts we might have. Each of us has to decide what the right balance is between being effective and being honest."
-vs-
"On the one hand, as scientists we are ethically bound to the scientific method, in effect promising to tell the truth, the whole truth, and nothing but – which means that we must include all doubts, the caveats, the ifs, ands and buts. On the other hand, we are not just scientists but human beings as well. And like most people we’d like to see the world a better place, which in this context translates into our working to reduce the risk of potentially disastrous climate change. To do that we need to get some broad based support, to capture the public’s imagination. That, of course, means getting loads of media coverage. So we have to offer up scary scenarios, make simplified, dramatic statements, and make little mention of any doubts we might have.. Each of us has to decide what the right balance is between being effective and being honest. I hope that means being both." This “double ethical bind” we frequently find ourselves in cannot be solved by any formula. Each of us has to decide what the right balance is between being effective and being honest. I hope that means being both."
There is no substantial difference between the two. The lines typically omitted from the quote are:
(1) Explicitly stating that being bound to the scientific method is "in effect promising to tell the truth, the whole truth, and nothing but – which means that we must include all doubts, the caveats, the ifs, ands and buts." Thanks for clarifying.
(2) Stating his position on climate change "And like most people we’d like to see the world a better place, which in this context translates into our working to reduce the risk of potentially disastrous climate change."
(3) Claiming the ethics of being a human who believes in potentially disastrous climate change exists in addition to the ethics scientists are bound to by the scientific method - "This 'double ethical bind' we frequently find ourselves in cannot be solved by any formula."
(4) As I stated in a previous post, he bemoans that the last line - "I hope that means being both" - is typically ignored. Great, so he hopes that he and other scientists don't have to resort to making stuff up to get media attention, don't have to conceal doubts, caveats, etc. Wow.
So there it is in its entirety. Now tell me how the full quote is any better than the abbreviated quote - let alone absolves Schneider for making extremely horrific implications regarding the actions or potential actions of climate scientists - or STFU.
Oh but don't STFU just yet, Phil. Maybe you or someone else can solve the problems with the data on the number of observations. Zeke posted over there, "The >9999 values reading as ***** in the obs count file does seem to be a real bug, however." Maybe you can address Zeke's post along with Eternal Optimist's findings posted here and determine them to be "lies" as well.
Oops.
Phil and Ken, you seem to have got yourself into a pickle about Schneider's statement! As people have pointed out to you, the full quote is just as bad as the abdriged one. Oh dear...
@Michael J
I have doubts now about the unadjusted anomalies file as well. It is at least partially suspect.
How can all the anomalies in a 5x5 cell over 160 years be positive ??
what on earth are they anomalous to ???
ATTP's link to a Winnipeg teenager's blog for the Schneider quote is interesting. http://www.cbc.ca/news/canada/manitoba/winnipeg-teen-s-climate-blog-wins-kudos-1.825137
17 year old Kate Alexander (a PhD student in 2009 and still a PhD student in 2016) makes clear "the debate over the cause of climate change among scientists has ended." so there is no reason to even have Schneider's "uncertainties" to conceal.
Perhaps following the Lewandowsky Trail to Australia, where massive fossil fuel profits generously fuel research, she is "using ocean models to study how the Southern Ocean might melt the Antarctic Ice Sheet from the bottom up....to get a better understanding of how much and how fast the ("corrosive") sea level will rise over the next few centuries. If we’re going to have to move Miami, Shanghai, New York, and countless other major coastal cities, it would be good to have a few decades’ notice." No worries mate. http://climatesight.org/
Let me clarify for Steven Mosher and others. I analysed the coverage for the two hemispheres using the gridded data (i.e. the 'median' file, in ASCII) and found that the coverage of the NH didn't correspond to the HadSST3-nh.dat file but to the HadSST3-sh.dat and vice versa. (My data was outputted to two decimal places and the -nh and -sh.dat files to whole numbers so I rounded to whole numbers before comparing.)
Someone here mentioned the temperature anomalies in the two files. I haven't checked them yet, my alarm bells went off with the coverage mismatch.
I'm puzzled by the reported different count of overflowed fields in the observation counts file. I'm using data as it was in late January (i.e. after the January update). It'll be curious if more recent data shows even more cases back in time. That could be due to probably several things, including a possible failure to initialise counts to 0.
I'll do some further exploring and get back to you.
– EternalOptimist, John McLean and Mosh
Since all the various files seem to have data in (36 x 72) matrices (the world-5SquareDegree-grids), it wouldn’t take much for one of them to be 180-degrees out-of-sync with the others: [(1,1)..(36,72)] in one relating to [(36,72)..(1,1)] of another. I didn’t find (nor look very hard) for meta/’about’ files that talk to this kind of problem, which is why detailed meta-info is so important in making sense out of libraries of stuff. By the way, I did find a kind-of sideways reference to the two matrix rows for the earth-poles (in meta-info for another file altogether): for that particular file, matrix cell (1,1) contains the content for one pole and cell (36,72) contains that for the other pole. The rest of the grid-cells for their affiliated rows should contain the ‘no-data’ marker. Also, given that it seems that the intra-file meta-data seems not only to imply the use of no-data markers for grid-cells with ‘no-data-acquired’, but also for data grid-cells that would represent land-grid-cells. Graphically mapping this stuff (a month at a time) might give an indication of data-orientation, since the no-data markers of land-forms should jump out visually quite easily.
Thanks, Mosh, for the quick code to look at the NetCDF files (here and at WUWT). My problems have more to do with what that code truly says in the operation of the content of the grid-matrices and how I can apply it to the ‘…number-of-obs…txt’ (i.e., 'counts') file of interest with a world-map, thus my lack of R knowledge impedes my progress.
My other concerns about the ‘counts’ file have to do with the proper use of such data in statistical analyses of the grid-cells of the other related files that have observation-content (any uses of means, medians, std-devs, variances, regressions, etc — what are the codes’ internal behaviors when dividing/multiplying by either zero or ‘large’/infinity/not-a-number for a given grid-cell — that’s neither trivial nor necessarily obvious in a given implementation — does the language-system throw errors or just ‘do-something’).
- John McLean
I am doing my review of these files based on the Feb 2016 'current' files that I pulled on Mar 26. So far, I'm only looking into the '...Numbers-of-Obs...txt' ('counts') file.
I was also struck by the values in the neighboring matrix-cells for a given month (I assume they represent the same latitudes). When I saw an 'overflow' value, I also noted that some or both of the neighbor cells on the same row showed some pretty large count values. We are assuming that these matrix cells represent centered lat/long values, but they are not explicitly identified, so, if they are mis-mapped relative to any of the other files, we can get all kinds of interesting interpretations. Also, the filenames seem to be clues to their content, but, in the case of the 'counts' file, what source file(s) are being used to count 'observations' (so that we can cross-check)?
@John McLean
John, my first post about the number and dates of the ******* cells was in error. I now think that your take on this was the correct one.
@OldUnixHead
I tried reversing the data in the count of obs by 180 and in some cases it puts high counts into land locked cells, so I do not think that it's 180 out.
I think I will put what I have into a grid, and see if I can detect any shapes resembling the land mass/oceans, to see if it is a simple offset
Eternal Optimist (and others),
The counts aren't 180 degrees out but seem to be mirrored across the equator (eg. what is supposed to be 30N is in fact 30S). I "corrected" the problem by writing all the data to a new file. For each month I copied the header record then read all 36 records for the observation counts per cell, then wrote those 36 records in reverse order.
The "overflow" counts then occurred along the coast of the USA rather than near Easter Island.
@John
I had the highest count of ******* at Easter island. The second largest concentration is at (122.5 W 47.5 S) (12,28)
In the middle of the south Pacific w of southern chile.
Following your method, this would put it in Washington state, possibly Seattle.
@John
If I take all the k's of obs at Mt Everest and apply your method , I should be looking at the Indian ocean and I should get zero obs (because this is the data for the Himalayas)
so (86 E, 27.5 N) becomes (86 E,27.5 S)
and that cell has zero observations
It looks like you are spot on John McLean,
the numbers are right, obs count, long lat. But the sign for Lat is reversed
I realise that people here have no interest in being charitable, but let me explain how I understand what Schneider was trying to get across. If you are a scientist who is engaging publicly, you are often limited in what you can say; 1 minute on a radio show; a couple of minutes on the TV news; a 10 minute chat with a journalist who is writing an article; an article in a popular magazine that is a few hundred words long. You can't say everything, therefore you have to make a judgement. Do you stress the caveats and uncertainties and leave people with the view that we're very uncertain when, in fact, we're not? Do you stress things that gets the message across that this is an issue that we should be taking seriously? As Stephen Schneider said (and as I also believe) we should try to be both honest and effective; precisely how to do that takes judgement and not everyone will agree on how it should be done. Just because you disagree with someone, does not make their behaviour unethical.
My personal view is that Stephen Schneider will be remembered as a great science communicator. My personal view is also that most here will simply be forgotten, but - if not - will be remembered as amongst those who denigrated someone because you disagreed with what they were saying.
the climategate emails showed that all these supposed "scientists" were really little nasty pathetic politicians and behind the curtains mongerers. All the suspicions were confirmed on them.
Now a "scientist" describing flooded roads doesnt take into account human ingenuity, he cannot predict that at all, so thats a scientist using his precious minutes for PROPAGANDA, to start with.
Heh, Ken, Schneider's the Boy Who Cried Wolf in order to sound more effective. He was more effective, but what did he effect? Why simply a dishonest view of the need for alarm. The villagers stampeded out to the pasture, and for what?
The 'for what' is for you; you defend the boy who cried wolf. C'mon, how about some effective communication; your defense still doesn't produce a wolf, the boy's still in trouble with his folks, the sheep graze.
==============
ATTP said: "...most here ... will be remembered as amongst those who denigrated someone because you disagreed with what they were saying."
And calling most here "deniers" is different in what way?
Ken, for grins go read the excerpts from Louis Bergkamp that Judy has at her blog, judithcurry.com, for a view of the mess your boy, and his fellow wolf criers, have gotten us into with your politicized science.
I am a little amused that binding commitments @ Paris were avoided partly because the US didn't want the agreement to be submitted to the will of the people, in this case, the US Senate.
===============
Poor scientists, struggling to get their message across in a few seconds of radio or "2 minutes of TV news"!
Having just endured hours of CBC's Easter weekend celebration of David Suzuki's 80th birthday, Canada's multi-millionaire "top scientist" with decades of his own hour long TV and radio programs, his own heavily funded Foundation repeating the "disaster is upon us, it's almost too late" message, expertly framed, flooding daily through my internet feed, often with the signature of mass media like the Guardian with announced policies to abandon "balance" in favour of campaigning, my nose bleeds for them.
ATTP,
Obviously when one is limited in the time/space to get across a message, one can't provide every caveat, doubt, etc.
A scientist can and should simply provide scientific facts instead of, "have to offer up scary scenarios..." and "decide what the right balance is between being effective and being honest."
Schneider was clearly advocating dishonesty from climate scientists if that's what it took to get an activist message across about climate science. His justification was that the human portions of climate scientists can operate under different rules than the scientific sides if they "have to." He just "hopes" they don't "have to" resort to such things.
The context of being put on the spot to provide soundbites and not having the time to spell-out caveats, doubts, etc, doesn't change anything. One could argue that the less time/space if afforded a climate scientist, the more blunt and truthful he/she should be. Save the "scary scenarios" for when one DOES have lots of time/space and CAN go into caveats, doubts, etc.
As for being charitable, Schneider had a chance to retract what he said. Instead he bemoaned the lack of the full quote, as if that made a difference.
I can't think of any other scientific realm that operates like climate science. This is just one example of it. What he said was completely indefensible, and yet that's what people like you do because of who he was and what he stood for.
Zeke's comment in March 25th did us no favours. He's talking about temperature anomaly BUT the problem is with the percentage coverage, which is the second record for each month in theHadSST3-nl.dat file.
"My personal view is that Stephen Schneider will be remembered as a great science communicator. My personal view is also that most here will simply be forgotten, but - if not - will be remembered as amongst those who denigrated someone because you disagreed with what they were saying.
Mar 28, 2016 at 11:54 AM | ...and Then There's Physics"
In the immortal words of Mandy Rice-Davies - "You would say that, wouldn't you?"
Still, credit to you for taking leave from work to enlighten us.
@John McLean
ref the coverage
I don't know if this confirms your point, but I find that, roughly
1850 NH coverage 17 SH coverage 21
1900 NH coverage 33 SH coverage 29
1950 NH coverage 47 SH coverage 55
2015 NH coverage 71 SH coverage 65
also (roughly)
NH gets higher coverage during the winter nov dec jan
SH gets Higher coverage the winter apr may jun
Schneider's quote is from a time that was (mostly) pre-blogs, pre-Twitter, pre-Facebook, etc.
ATTP, for instance, comments here, there and everywhere, and apparently also has a blog. Maybe he's quoted in the MSM, I'm not that interested in finding out.
But I would point out that most people under 40 get most of their information from online sources now. I believe that other than free commuter papers like "Metro", most people under 30 have never actually read a newspaper, and certainly have rarely purchased one. Most haven't sat down and watched a one hour TV show, complete with commercials, on a real TV.
So the idea that there isn't enough "space" in 2016 to show the uncertainties of science is a bit of a stretch.
Like most nerds, I read things from the back forward. I'll scan the summary then head to the "guts" of the appendices. Why? Because I've written too many government reports where my job was to, if not outright hide the bad news, then downplay it, and hoped nobody actually read the dozens of caveats or look too hard at the actual data.
Another oddity with the download files.
The HADSST.3.1.1.0.Median.zip is supposed to contain actual median temperatures in degrees centigrade.
That would be enormously useful, esp in checking the graph above.
unfortunately the file appears to contain anomalies. unless the equator is beset by icebergs for half the year.
The graph at the top of the post has median differences between 1961 and 1990, colour coded by degrees centigrade on a 72 x 36 grid.
where that data came from beats me.
I hate to say it, but the whole thing is starting to look a bit shoddy.
One last post on these oddities.
I wanted to check out one of the real hotspots, so I tried (60W, 45 N) which is around (24,9)
the only hot spot I could find WAS 24, 9.
according to that map , 1990 was a 5-10 degree anomaly hotter than 1961.
now based on the assumption that John McLean is right about the upside down obs
based upon my assumption that the median file contains anomalies, not absolutes
based on the assumption that the legend on the map above is correct and
therefore the map is using median anomalies
this comparison is not supported by the data
1961 only had 7 obs.
1990 has 165 obs
the biggest gap between the obs is 0.48 in july 1961 cf 3.06 in june 1990
that max of 2.5 degrees is shown as 5 - 10 degrees
in 1961 that cell had 7 obs over three months
1990 it had 165 obs over 11 months
I am no statistician but it sure looks like the maximum possible is being multiplied by the obs or the months containing obs.
I can confirm one of the issues raised. In the ASCII files at http://hadobs.metoffice.com/hadsst3/data/download.html, the number of observations and the sampling uncertainty values are upside down. That is they are upside down when compared to the format description or the anomaly temperatures in the median file.
Anyone can see this for themselves. I've put together a little web page to browse the data at http://climate.nixsoft.net/hadsst/ Pick a year and month and then view the data. if you pick a recentish year with lots of data and you kind of squint at the screen you can see the continents of africa and south america. If you then look on the count and errors tabs you can see it's inverted.
I haven't checked any of the other issues. Also I haven't checked the netCDF files 'cos I can't see an easy way of reading them. Haven't checked the previous versions either. Or what all these realisations? are.
The files on the CRU website containing the NH and SH averages of HadSST3 contained the correct temperature anomalies but the values for the percent coverage of the hemispheres were incorrect (the NH and SH values were swapped). They have been replaced with corrected files today. Thanks to John McLean for noticing that there was a problem with these files.
The global-mean file was correct, as were the HadCRUT4 and CRUTEM4 files. If you downloaded the HadSST3 NH or SH files before 30 March 2016, please download them again.
Does anyone have any ideas on how the MO combined monthly anomalies into annualised for each cell, in order to produce the comparison on the map at the top of the post ?
Thanks, Tim. Only trillions in policy dependent upon you guys.
========
Wow The Metoffice confirmed the original investigation. Warmists zero.......
The files on the CRU website containing the NH and SH averages of HadSST3 contained the correct temperature anomalies but the values for the percent coverage of the hemispheres were incorrect (the NH and SH values were swapped). They have been replaced with corrected files today. Thanks to John McLean for noticing that there was a problem with these files.
The global-mean file was correct, as were the HadCRUT4 and CRUTEM4 files. If you downloaded the HadSST3 NH or SH files before 30 March 2016, please download them again
Good that the data keepers have acknowledged and corrected the problem.
However, it begs the question:
Are these files produced 'programatically' (ie via a script) or is there manual input?
I would like to think that once the data has been captured, all processing was automatic and script driven, if so how did the error come about.
If there is some chunky manual intervention, then can we trust any of the existing data?
CRU have updated their data files and put a correction note on the web page. However, Hadley Centre haven't corrected the data on their site yet. So the count and uncertainty gridded datasets at http://hadobs.metoffice.com/hadsst3/data/download.html are still upside-down compared to the median.txt file (and description).
I cannot reconcile the world grid at the top of this post with the median file
Does anyone have any ideas on how the MO combined monthly anomalies into annualised for each cell, in order to produce the comparison on the map at the top of the post ?
Would someone help break down the meaning and importance of this for me? I do not want to be too harsh on Tim Osborn, for what is clearly an honest gesture.
=====================
i trust that clown attp will be along shortly to apologise to john mclean . no surprise education standards have been dropping in my home country if he is any sort of example of those providing it.