Buy

Books
Click images for more details

The extraordinary attempts to prevent sceptics being heard at the Institute of Physics
Displaying Slide 2 of 5

Twitter
Support


Recent comments
Why am I the only one that have any interest in this: "CO2 is all ...
Much of the complete bollocks that Phil Clarke has posted twice is just a rehash of ...
Much of the nonsense here is a rehash of what he presented in an interview with ...
The Bish should sic the secular arm on GC: lese majeste'!
Recent posts
Links

A few sites I've stumbled across recently....

Powered by Squarespace

Entries in Climate: Surface (320)

Friday
Mar252016

Some oddities in HadSST

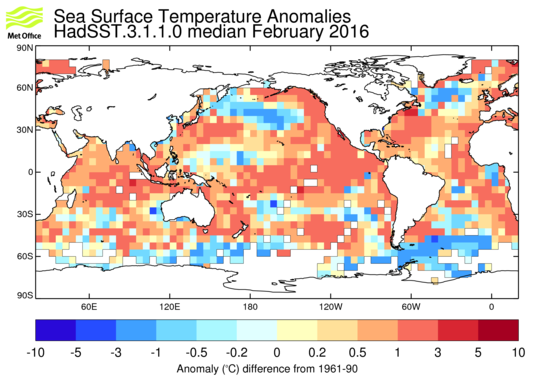
Reader John McLean emails with details of some surprising finds he has made in the Hadley Centre's sea-surface temperature record, HadSST. John is wondering whether others might like to take a look and confirm what he is seeing. Here's what he has found:

1 - Files HadSST3-nh.dat and HadSST3-sh.dat are the wrong way around.

About 35% down web page https://crudata.uea.ac.uk/cru/data/temperature/ there's a section for HadSST3. Click on the 'NH' label and you go to https://crudata.uea.ac.uk/cru/data/temperature/HadSST3-nh.dat, which has 'nh' in the file name.  But based on the complete gridded dataset that data file is for the Southern Hemisphere, not the Northern.  The two sets are swapped.  The links to named files are correct but the content of those files is wrong, likely due to errors in the program that created these summary files from the  SST3 gridded data.

Click to read more ...

Thursday
Jan212016

Hot, apparently

© Copyright ronnie leask under CC licence. Click for link.So the stove is on, and outside the snow is starting to melt a little. It looks as though a thaw will set in by this evening.

Meanwhile Twitter and the newswaves are awash with tales of warmest years, although I have to say most of it has passed me by. I did pick up this interesting exchange on Josh's feed though.

Click to read more ...

Tuesday
Jan122016

"Nothing in it is correct"

The eminent statistician (and occasional BH reader) Radford Neal has been writing a series of posts on global temperature data at his blog. There are three so far:

What can global temperature data tell us?

Has there been a pause in global warming?

and finally

Critique of "Debunking the climate hiatus", by Rajaratnam, Romano, Tsiang and Diffenbaugh.

Click to read more ...

Friday
Jan082016

The BBC and the chief scientist

Ben Pile highlights a fascinating comment at Guido's blog:

In 2010, I was on a research trip to an area north of Svalbard. We were lucky enough to have a So-Called BBC journalist along for the ride. Unfortunately, my cabin was very close to his which meant that I had to listen to him editing his riveting reports about Climate Change™ before they were broadcast on BBC Climate Change 24. He'd just interviewed a Danish glaciologist that we had with us who explained a process with the sea ice that was "a negative feedback" (contrary to climate change bollox). I heard Mr X, the journalist, rewind and replay the tape about 5 times before he finally rang the chief scientist for advice because "I'm not sure this is putting out the right message...."

This raises a few questions: is this the government chief scientist that is referred to? And who was the BBC journalist? I'm struggling to find a BBC article about Svalbard around that time.

It would be extraordinary if the BBC was contacting the GCSA for "lines to take".

Thursday
Jan072016

Sticking one's neck out

Updated on Jan 7, 2016 by Registered CommenterBishop Hill

I avoid making predictions about the evolution of surface temperatures over the period of a few years. Those who choose to do so are frequently get themselves into trouble. James Annan lost his bet with GWPF's David Whitehouse and it looks as if GWPF's Sir Alan Rudge will lose out to Chris Hope on another wager.

Click to read more ...

Friday
Jan012016

Holthaus thoroughly maued and knappenburgered

With all the stories of unprecedented weather in recent weeks it's important to observe that none of these claims ever seem to be accompanied by any historical context.

One of these stories has of course revolved around the warm weather at the North Pole. While much amusement was had at the hapless journalist from Time magazine who mistook the settlement of North Pole, Alaska for the actual North Pole, there is no doubt that the pole proper did experience a short burst of unseasonably warm temperatures, bringing the inevitable claims of impending apocalypse from the usual suspects. 

Kudos then to Ryan Maue of Weatherbell for making available his dataset of estimated temperatures for the Pole and to Chip Knappenburger of Cato, who has published the figures as the graph below.

Apocalypse cancelled.

Again.

Friday
Dec182015

We forgot the geography!

The British Medical Journal recently held a Q&A on climate science with, among others, Brian Hoskins. The results are paywalled, but I was amused by the excerpt from the start of the session in response to a question about why Antarctic sea ice is growing:

The anomaly in the Antarctic is due to its geography. Unlike in the Arctic, where the extent of sea ice is constrained by the North American and Eurasian land masses, Antarctic sea ice forms in the open ocean with less land constraining its formation. Antarctic sea ice is also thinner and mostly melts each summer, whereas Arctic sea ice survives longer (although the amount of sea ice lasting more than two years has declined rapidly since 1979).

If the growth is "due to its geography" you have to wonder why the climate models predicted a decrease. Perhaps climate modellers forgot to put the geography in?

Thursday
Dec172015

Surfacestations: the punchline

And what a punchline it is. Anthony has finally published the results of his epic Surfacestations project, and it seems that the surface temperature record is as flawed as we thought. Here's the text of the press release.

SAN FRANCISO, CA – A new study about the surface temperature record presented at the 2015 Fall Meeting of the American Geophysical Union suggests that the 30-year trend of temperatures for the Continental United States (CONUS) since 1979 are about two thirds as strong as officially NOAA temperature trends.

Using NOAA’s U.S. Historical Climatology Network, which comprises 1218 weather stations in the CONUS, the researchers were able to identify a 410 station subset of “unperturbed” stations that have not been moved, had equipment changes, or changes in time of observations, and thus require no “adjustments” to their temperature record to account for these problems. The study focuses on finding trend differences between well sited and poorly sited weather stations, based on a WMO approved metric Leroy (2010)1 for classification and assessment of the quality of the measurements based on proximity to artificial heat sources and heat sinks which affect temperature measurement...

Click to read more ...

Tuesday
Dec152015

Sierra Club silliness

Many thanks to John Shade for this hilarious video from the US Congress, which I hadn't seen before.

Saturday
Dec052015

Is underlying warming only 0.8 degrees per century?

A new paper by Craig Loehle tries to address an area that has frequently been the cause of criticism of mainstream climate science -namely the blind eye it tends to turn to questions of natural variability. It's not online, but here's the abstract.

Multidecadal climate variability has proven difficult to deal with when estimating temperature trends. This possible unforced internal oscillation of the climate system provides an opportunity to correct temperature trends. The Atlantic Multidecadal Oscillation (AMO) is proposed as a potential index for this unforced variability. The AMO pattern does not appear to correspond to forcing histories used by the IPCC. Subtracting a scaled version of the AMO from the Hadley global temperature data produced damped decadal-scale fluctuations in the temperature data. The adjusted dataset is highly correlated with the anthropogenic forcing history from IPCC AR5. The linear post-1970 temperature trend is 0.83°C/century vs. 1.63°C/century for the raw data. Thus almost exactly half of the post-1970 warming is possibly natural. The use of the AMO as an index of unforced variability is supported by the fact that subtracting it simplifies the temperature response by damping the peaks and troughs consistently.

 In the main text, Loehle says that these results imply estimates for ECS of 1.5 and for TCR of 1.21.

Wednesday
Dec022015

Integrity and the climate scientist

Here's an excerpt from Matt Ridley's article in the Times a few days ago.

How unusual is today’s temperature? As I did this weekend, you have no doubt had conversations along the following lines recently: “Hasn’t it been mild? End of November and we’ve hardly had a frost yet!” All true. But then be honest: can you not recall such conversations throughout your life? I can. And here’s what the Met Office had to say about November 1938, long before I was born: “The weather of the month was distinguished by exceptional mildness: at numerous places it was the mildest November on record.” In 1953, November was even milder and there was no air frost recorded in Oxford in the last four months of the year at all.

I am not saying it has not generally become warmer, but that the variation dwarfs the trend. Let’s go back a little further, to the Middle Ages. It used to be argued by some that the “Medieval Warm Period” of about a thousand years ago, when mountain glaciers retreated, vines grew further north and Iceland was widely cultivated, was confined to Europe. We now know from multiple sources of evidence that it was global. Tree lines were higher than today in many mountain ranges, for example. Both North Pacific and Antarctic Ocean water temperatures were 0.65C warmer than today.

And here is a letter from Professor Joanna Haigh in response:

Sir, A quarter of a century after Margaret Thatcher first warned of the perils of climate change, it is disheartening to find columnists in the UK media still confusing weather with climate and anecdote with evidence...

Personal conversations about British November weather cannot be a substitute for global observations of climate change — not only increasing temperatures but ice melt, the migration of wildlife, the acidification of the ocean, and so on. These observations confirm that man-made climate change presents real and increasing risks for the future.

The green establishment is not exactly covering themselves in glory on the integrity front at the moment are they?

Monday
Nov232015

Quote of the day, science with Guardian characteristics edition

Without a Paris agreement, global warming is set to reach as much as 5C (41F) above pre-industrial levels. Scientists estimate that warming above 2C (35.6F) will result in catastrophic and irreversible changes to the weather, including droughts, floods, heatwaves, fiercer storms and sea level rises.

Fiona Harvey, award winning environment writer for the Guardian, struggles with mathematics

Sunday
Nov222015

Settled science

Much amusement is to be had from a posting at a blog called Sudden Oak Life. The author has recorded images of the Radcliffe surface temperature station in Oxford, part of the Central England Temperature Record and one of the longest temperature records there is.

It's fair to say the quality of the record has declined since the 18th century.

Read the whole thing.

Friday
Nov062015

Snow grow situation

Over on unthreaded, Sandy points us to this article at a blog that specialises in monitoring snow patches in the Scottish Highlands. The trend in August snow patches is not what you'd expect.

Tuesday
Oct272015

Meehl bashes Karl

The US CLIVAR project publishes a newsletter/cum journal, a recent issue of which was dedicated to the hiatus in global warming. Featuring papers from a variety of well-known climatologists, I was interested to see the headline article, from Gerald Meehl, which seems to take a fairly hefty pot-shot at the data tweaking approach adopted by many climatologists.
There have been recent claims that the early-2000s hiatus...was an artifact of problematic sea surface temperature (SST) data (Karl et al. 2015), lack of Arctic data (Cowtan and Way 2014), or both. Such claims indicate that when corrections are made to SST data, by taking into account various measurement methods that introduce biases in the data, then “there was no ‘hiatus’ in temperature rise...[and] a presumed pause in the rise of Earth’s average global surface temperature might never have happened” (Wendel 2015). Often there are issues with observed data that need adjusting - in this case such claims of “no hiatus” are artifacts of questionable interpretation of decadal timescale variability and externally forced response - not problems with the data. Thus, the hiatus is symptomatic of the much broader and very compelling problem of decadal timescale variability of the climate system.
Whether Meehl is any more correct than Karl is anyone's guess though.