


 Bishop Hill
 Thou shalt extrapolate
Climate: Surface John Cook, of Skeptical Science fame, has an article in The Age, in which he is very rude about Bob Carter:
A Yiddish proverb states ''a half truth is a whole lie''. By withholding vital information, it's possible to lead you towards the opposite conclusion to the one you would get from considering the full picture. In Bob Carter's opinion piece on this page yesterday, this technique of cherry-picking half-truths is on full display, with frequent examples of statements that distort climate science.
One bit of the article that stuck out at me was this:
[Carter] has long hung his hat on the proposition the climate has been cooling since 1998. But with 2005 and 2010 being the hottest years on record, he resorts to cherry-picking which dataset to use. Rather than use temperature records that cover the entire globe, he opts for datasets that do not include the Arctic region, where warming is the strongest. These temperature records underestimate recent warming and are the darling of those who wish to deny global warming is happening.
Now this is interesting. As readers here know, there are almost no temperature stations in the Arctic and the gaps are therefore infilled by extrapolation.
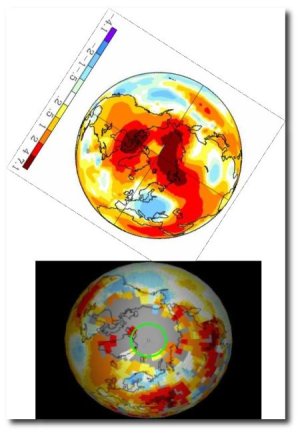 Now, I don't know about you, but I'm not sure that it is reasonable to get on one's high horse complaining about somebody who prefers to look at, you know, actual data rather than the outpourings of a mathematical model.
Certainly, to accuse them of half truths seems, well, extreme.
Reader Comments (226)
dana1981: Concerning observational constraints on climate sensitivity, WG1 Chapter 9 (Section 9.6.1, p.718) says “The empirical ECS and TCR estimates discussed here are generally based on large ensembles of simulations using climate models of varying complexity, where uncertain parameters influencing the model’s sensitivity to forcing are varied that the range” while Chapter 10 (Box10.2 on p.798) says “These estimates were expert assessments largely based on equilibrium climate sensitivities simulated by atmospheric GCMs coupled to non-dynamic slab oceans”.
Data from empirical observational was certainly used to ‘tune’ the models but the confidence in their output must surely be related to the confidence in the underlying physical processes and interactions that they model? To put it another way, the results are based upon the assumption that all of the key physical processes and their interactions have been modelled well enough to capture all relevant behaviour of the real-world climate system. My concern is that this is not the case – mainly because of the acknowledged uncertainty over clouds and vegetation – and that using the models to assess the constraints on climate sensitivity may be both inherently limited and badly misleading.
Dana
Looking at WfT I am not sure that RSS is 0.15C/decade:
While things may have been different a year or two ago, I am happy to place higher confidence in the most recent revision. I appreciate that you have reservations about RSS and UAH trending low, but I ask again: why would RSS fail to remedy this problem?
It is reasonable at least to entertain the notion that GISTEMP is the outlier. The modelled transient climate sensitivity is 0.2C/decade 1979 - present, which is higher than observations.
When the focus switches to missing energy, the OHC estimate becomes central. And we agree that it is not currently reliable. You point to the thermosteric contribution to MSLR, but this requires confidence in the accuracy of satellite altimetry, tide gauges, GIA modelling and cryospheric shrinkage.
This is what underpins the apparent correlation of modelled projections of transient climate sensitivity and observations.
There's space for a rational debate about TCS and ECS being lower than the current accepted estimate. To be clear, I do not argue that this means it's all going to be fine and dandy.
But I think we should proceed cautiously and with open minds.
Dave Salt - my point is simply that empirically-derived climate sensitivity estimates fall within that same range, as I discussed in the link I provided in an earlier comment. The IPCC report and Knutti and Hegerl (2008) both have graphics which demonstrate this quite clearly.
BBD - I can't speak for the folks at RSS. Maybe they disagree with the aforementioned studies. It sounds like you're assuming their motivation is to prove UAH is wrong, which I don't think is the case. I think RSS is trying to create the best atmospheric temp analysis they can, but that doesn't necessarily mean they're right. I think there are a lot more question marks surrounding the satellite data than the surface stations, which have been under a microscope for quite a while now, so if there's a discrepancy between the two, I think it's more likely it's the satellite data that needs revising.
Anyway, throw out the argument about which data set is right. Use the WfT Index - the temp change since 1979 is 0.465°C. CO2 increase is 336.78 to 389.78 ppm. Neglecting other factors, that would give a transient sensitivity of 2.2°C. A quick and dirty calculation, but doesn't give any reason to doubt the IPCC range.
You have good reason to chortle, Josh.
The consensus establishment has been stuck in the same stage - on and on about 'clouds' and 'sensitivity' from 25 years. It's been the same refrain from the climate agony aunts. There will be no end to the 'sensitivity' issue, because it is a consequence of a framework of thinking - it has hit its conceptual ceiling.
Imagine this: water in the oceans is the most important entity responsible for the climate system inertia, in the form of ice probably the most important in influencing the planet's reflectivity, is the most potent greenhouse gas in terms of its total quantitative effect in the climate system and lastly, in the form of clouds the most 'uncertain' in its influence over the so-called enhanced feedback effect. And this problem has not been fixed yet.
Richard Lindzen said two things: (1) the earth's climate system has only one value for the purported 'climate sensitivity', and not a range. (2) that the wide gap in knowledge is precisely the place where the raison d'etre for climate alarm, resides.
Late to the party as usual. Wish I had more time for this. Who invented working for a living anyway? Bloke wants shooting....
"Anyway, throw out the argument about which data set is right. Use the WfT Index - the temp change since 1979 is 0.465°C. CO2 increase is 336.78 to 389.78 ppm. Neglecting other factors, that would give a transient sensitivity of 2.2°C. A quick and dirty calculation, but doesn't give any reason to doubt the IPCC range."
A "quick and dirty calculation" indeed. One that assumes all warming since 1979 has been entirely due to CO2. Even the IPCC don't claim that. I often see the figure of 50% bandied about and, assuming that is somewhere near correct (of course, nobody really yet knows) then that brings it back down to somewhere near 1.0C. A pretty big reason to doubt the IPCC range.
LC - no, I believe the IPCC said the warming over the last century is "mostly" anthropogenic. Over the past 40 years it's almost entirely anthropogenic.
BBD,
First, I really appreciate your style here. It's nice to talk to someone genuinely curious (and skeptical) and amicable. Cheers.
You're right. I haven't compared trends for a while, and last time I did UAH was the outlier. This change demonstrates a couple of points I made, which I'll get to in a sec.
We're not in disagreement about the altitude being measured. 14000 feet = 4.2 kilometers. So Ch 5 temps are derived from data within an altitude band that is 2100 times greater (or 4.2 kilometers higher) than surface measurements. (Woodfortrees uses t2lt data for UAH)
I'm not knowledgable enough about atmospheric meso-strata to agree or disagree, but I'd ask why you expect such good agreement.
On the other hand, I'd say a decadal trend difference between the various temp records of 0.025C is pretty good agreement! That's a centenary trend difference of only 0.25C.
Not if the period starts with an el Nino and ends on a la Nina, or if opposite sign ENSOs are clustered at each end of the record. Then the trends are influenced by the variation differences. I imagine that if the time period started and ended at the same ENSO phase (begin/end same part of the cycle), then the trends would agree better. But I haven't done the work for that, so I can't state it categorically. I might check it out later.
As it happens, 1979 had slightly above average ENSO readings, and the first two major ENSO events in the satellite time period were strong el Ninos (1983 & 1987). At the other end of the time period, 2008 and 2010/11 produced one strong and one very strong la Nina - the opposite sign from the beginning of the record. The amplification of ENSO fluctuations in the satellite records, in this case, makes the the satellite trend lower than surface.
While I'm not an expert on statistics, and someone else may correct me here, in general, I believe that the greater the variation in chaotic data, the more you need to get a statistically significant trend (95% confidence).
Taking on board the latest trends among the temp records, the gap between them has narrowed since last I looked. They are converging.
Regarding the original point, Bob Carter selected 1998 as the beginning of global cooling. There are two problems with this, the first being the major.
1) The trend for this time period is not statistically significant. There is not enough data to make a firm call.
2) 1998 produced the strongest el Nino on record. The trend is going to be strongly influenced by starting at that date for some time to come. Moreover, the end of the time period is marked by two strong la Ninas. The trend, then is strongly influenced by ENSO. If you subtract ENSO from global temperatures for this time period, the results are strongly positive - I don't know if the resulting trends are statistically signficant, however, but removing ENSO reduces the variability, so they just might be.
I computed the trend for 1) 1979 - 1998 inclusive, and then the trend for 2) 1979 - present. If the globe has been cooling since 1998, I would expect to see a lower trend for the second time period. These are the results.
HadCRU & UAH
Now we have statistically significant trends, and we are looking at any change from 1998 using the maximum amount of data points (well, I left off December 1978, but that won't make much difference). No cherry-picking here, just as much data as can be used to make the comparison.
We see that the positive trend for HadCRU is unchanged after 1998. For UAH, it has increased, which is counter-intuitive!. However, this caveat should be added - while the trends are statistically significant, their differences aren't, based as they are on only 13.5 years data. What we can say is that the globe has continued to warmed since 1998, but we can't say whether the warming trend has increased or decreased or stayed the same - not enough data yet.
Look forward to your thoughts.
Damn, I obviously formatted my hyperlink badly. here is the link to the trend plots.
http://www.woodfortrees.org/plot/hadcrut3vgl/from:1979/to:1999/trend/plot/hadcrut3vgl/from:1979/trend/plot/uah/from:1979/to:1999/trend/plot/uah/from:1979/trend
(You probably know, but just in case, the shorter plot lines are marked as 1979 - 1999, which means at woodfortrees that the data goes up to December 1998).
Bah, even copying source code from this page didn't help. Usual HTML tricks are failing. Apologies, but I'll just break up the URL and you can copy'n'paste to the address bar. If someone wants to learn me the code for hyperlinks for this site, I'd be grateful. The suggestion below doesn't seem to work.
http://www.woodfortrees.org/plot/hadcrut3vgl/from:1979/to:1999/
trend/plot/hadcrut3vgl/from:1979/trend/plot/uah/from:1979/to:1999/
trend/plot/uah/from:1979/trend
Here's a link to ENSO data if you want to confirm my comments on that.
http://www.esrl.noaa.gov/psd/enso/mei/table.html
In regard to temperatures Pears Cyclopaedia 83rd edition (1974-75) - General Information - Climate.
"Since the mid-19th cent. most of the world has shown a tendency to be warmer: the rise in annual mean temperature is now over 1C. But this trend now seems to be easing off".
Average global temperatures between 1901-2000 rose by around 1C (perhaps even less). The rate of increase in temperatures over the longer term of 150 years does not seem to have changed. Selection of the last 30 years of the 20th century is too short a period to determine an overall trend. This is particularly so when it coincides with a natural Pacific Decadal Oscillation warming cycle. Also, it seems disingenuous to claim increased CO2 levels were the cause of this warmer period when average global temperatures fell slightly during the mid-20th century and CO2 levels were rising. Similarly, the trend in average temperatures since 2001 has been flat yet CO2 levels have continued to rise.
Some scientists suggest an increase of aerosols in the atmosphere after world war 2 was the reason for the cooling in the mid-20th century. Does this mean the aerosols disappeared after around 1975 and have returned again this century?
@barry:
Precisely, that is a >a href=""http://img90.imageshack.us/img90/9646/screenshot20110629at952.png>chart I made just after your post with a few lines of coding in R using the data from the link you provided.
It is not only interesting, it has to be fully explained before we can have any confidence in future projections.
The same goes with the reanalysis data and the sudden jump correlated to diminishing number of stations. By the way, I also did that chart using data from NCEP/NCARand this time displayed in Grads
Dunno what 50% figure you're referring to, but if you mean the ~50% of emissions absorbed by the oceans, that's already accounted for in the ppm values. That's the net increase.
No assumptions are made about attribution to CO2. An enormous amount of work has gone into delineating various contributions to global warming, including solar, volcanic, and oscillatory ocean/atmosphere systems. There has been no significant trend in solar and volcanic output for nearly half a century, as far as we can detect, or for the last 34 9from 1979). This is different for the first half of last century, where those metrics do exhibit trends (volcanic much less certain than solar, though).
Far as we can tell, the warming for the last 50 years has been primarily forced by CO2, although hypotheses that large-scale weather oscillations may contribute.are interesting, if not yet convincing.
Also, as someone said upthread, the oceans are responsible for strong thermal inertia. Dana's calculations don't (I think) account for thermal lag - about 30 years. Doing so would make equilibrium climate sensitivity larger than 2.2C for his back of the envelope calcs. But Dana may correct me on this.
JC
"Without the warming effect of those elevated CO2 levels, the planet would've been a frozen ice ball"
But for the last 600 million years, temperatures have mostly been about 10 deg.C higher than they are now, while the CO2 has been all over the place. With respect, saying that you've looked at 'all the evidence' is trite, as you never know when you've got all of it - this seems to be especially true of climatology.
Dana
"Over the past 40 years it's almost entirely anthropogenic."
Extraordinary claims require extraordinary evidence...
Thanks to BBD and Dave Salt for demonstrating how Bob Carter should have argued a skeptical case. And for those worried by nasty extrapolation,well,who needs thermometry? Arctic land and sea ice is a damn good proxy that will take some explaining away. Oh,permafrost,too.
I don't agree. Positing a potential cycle, when there is not enough data even for a correlative study, seems more like wishful thinking. And I can't think of a rationale whereby we must focus on potential Arctic temp oscillations to project global trends to the end of this century. We need a physical basis for this, otherwise the stats are meaningless.
In any case, future projections are definitely off-topic, but I'd be happy to pick up the conversation elsewhere. Drop a link if you want.
dana1981: I certainly agree that ‘Knutti and Hegerl (2008)’ provides an extremely good overview of “The equilibrium sensitivity of the Earth’s temperature to radiation changes” and, indeed, this was one of the key documents that raised my concerns about the inherent limitations of the models when I read it several years ago.
http://www.iac.ethz.ch/people/knuttir/papers/knutti08natgeo.pdf
More specifically, it clearly shows how most of the estimates that use empirical data still rely upon model ensembles to test their conclusions, while those that use ‘statistical models’ or ‘energy balance calculations’ show wide variations or are considered ‘weak’ (e.g. those that assessed the response to Mount Pinatubo).
Here is an example of a clear statement that raised my concern…
(p.739) “There are few studies that yield estimates of S that deviate substantially from the consensus range, mostly towards very low values. These results can usually be attributed to erroneous forcing assumptions (for example hypothesized external processes such as cosmic rays driving climate), neglect of internal climate variability, overly simplified assumptions, neglected uncertainties, errors in the analysis or dataset, or a combination of these. These results are typically inconsistent with comprehensive models.”
Yes, the idea of cosmic rays driving climate may well be erroneous but this still debatable, especially when experiments like CLOUD seem to be providing some rather interesting results that may actually support this hypothesis. Moreover, that last sentence smacks of circular logic if, indeed, there are significant ‘structural’ problems with the models. Here’s another clear statement that highlights this issue…
(p.740) “Structural problems in the models, for example in the representation of cloud feedback processes or the physics of ocean mixing, in particular in cases in which all models make similar simplifications, will also affect results for climate sensitivity and are very difficult to quantify.”
I like ‘Knutti and Hegerl (2008)’ because, just like IPCC AR4 WG1 report, it is quite candid about the uncertainties and goes out of its way to highlight areas where major improvements are needed. It is therefore, in my opinion, a good example of how scientific evidence should be presented. However, when people use these sources to support the case for CAGW without highlighting these caveats (i.e. accentuating the positive and eliminating the negative) they become nothing more than PR material and political spin that have nothing to do with science.
So Dana, do you ever plan to walk up to John sometimes and say: "Hey John, you know the message that we put out on t-shirts and coffee mugs, you know,....people are asking me questions about it which I am not able to answer. So, do you mind looking into it?"
barry -
No, you're correct. My calculation was of transient sensitivity.James P -
I don't see what's extraordinary about the claim. What would be extraordinary would be if natural variability could cause a 0.5°C warming in just 30 years. Regardless, barry provided a good partial summary of how we know the warming is anthropogenic. There's also the many anthropogenic 'fingerprints', and basic physics.Dave Salt - there will always be uncertainties, but Knutti and Hegerl highlight that both models and empirical observations (mainly paleoclimate) are consistent with the 1.5 to 4.5°C sensitivity range. If sensitivity were substantially lower, the planet could not transition between interglacial and glacial periods, for example. The forcings are not large enough to account for the required temp change (~5°C) if sensitivity is low. I've yet to see a "skeptic" explain glacial-interglacial transitions with low sensitivity.
Moreover, it's important to realize that uncertainty is not our friend. Larger uncertainty means we can't rule out the worst possible consequences - the "C" in "CAGW". Things are just as likely to be worse than we think as better. In fact due to the long tail on the climate sensitivity probability distribution, it's actually more likely to be worse than we think than better.
The only way to argue for inaction or delaying action is if we're certain the consequences won't be bad. Uncertainty as to how bad they will be should give us even more reason to act.
barry
Kind words, thanks. I enjoy a good scrap as much as anyone, but there's a time and a place. Otherwise, I'm with you on this: amiable discussion trumps a bar fight. And I appreciate that you stayed on.
I think I see what you are getting at, but what I 'like' about the TLT estimates is the way that they have differed and then converged until 2LT gets the same trend as the RSS methodology.
WRT the expected good agreement in trend between SBL and TLT, may I invert your question and ask: why would you expect there not to be good agreement?
Agreed, but I was pointing to the possibility that GISTEMP is the outlier and UAH/RSS TLT are more reliable for trend. Compare to the multi-model mean of 0.2C/decade and the centennial undershoot is now 0.6C. I'm not literally suggesting this figure should be on the table, but I think we should avoid trying to lock down every number while asserting that there's nothing worth noting here.
Thanks for the clarification about the possible effects of ENSO on the satellite trends:
I think it's reasonable for me to argue that there's enough going on to avoid a skewed trend 1979 - present. Consider El Chichon in '82 and Pinatubo in '93 and the strong and extended 2009/10 El Nino. Also, although TLT has a more pronounced response to these events than surface T, surface T still responds. This is clear from the comparison graph I posted earlier in the thread (common 1981 - 2010 baseline).
Just as an aside, I did mention upthread the odd way in which GISTEMP is peaking higher than RSS and UAH in recent years (common 1981 - 2010 baseline): see 2002, 2007, 2008, 2011. As I've said, this is puzzling and not expected. It's something else that makes me treat GISTEMP with caution.
As you may recall I wasn't defending Carter and I did say we shouldn't over-interpret a short period. But what is interesting here is the way the flat trend over the last decade is being interpreted by Hansen and Trenberth.
Your example correctly avoids short time-series, and neatly avoids focussing on whether the expected recent accumulation of energy in the climate system has:
- been abruptly subducted into the deep ocean without apparently leaving a signature on its way down through the 700m layer
- has been reduced because hypothesised stratospheric aerosols of uncertain origin reflected solar SW back into space
- has radiated into space because the climate system is responding is subtly more efficent ways than expected to additional CO2 forcing
These do have a bearing on TCS and ECS to a doubling of CO2 and to my mind no convincing explanation is currently in play.
As I have said several times: we should proceed cautiously and with open minds.
Thanks again for your various detailed and thoughtful responses.
Dana
- BRIC won't play
- Kyoto is dead
- Renewables are a sideshow when it comes to displacing coal from the energy mix
- Nuclear might, but we should have started a massive expansion at least a decade ago
What 'action' do you propose?
barry, dana1981, John, it is indeed nice to have civil visits from Skeptical Science supporters. It is also nice to see you having a nice set of exchanges with Dave Salt, BBD, and others. It is unfortunate that there were some less amiable exchanges, but this is climate science, and that tends to throw up such things. Skeptical Science, though it has some strengths, has not been immune from posting some fairly aggressive attacks on other people - this is after all the topic of this thread.
Those general points aside, this comment is mainly a response to dana1981's comment today at 4:53 pm, and its discussion of uncertainty, partly in response to James P's comment this morning at 9:15 AM. I am often struck by how what I would call 'consensus people' tend to downplay uncertainty in discussion of risks, attribution of warming, measured magnitude of warming, and projections of future warming. Your exchange with James P is a good example: you had claimed with apparent confidence that the largest part of the warming in the last 40 years is anthropogenic. In reply to James P, you back that up with a reference to barry's reply, and, ultimately, to 'basic physics', and you therefore seem to attribute a very low uncertainty to that conclusion. Now, I'm a lukewarmer, but I will freely admit to pretty high levels of uncertainty as to what I think the effect of doubling CO2 will be on global temperatures. So I don't rule out that it will be greater than two degrees, or indeed that it might be six degrees. But I know for sure that it is not 'basic physics' to derive a six degrees or even two degrees effect. You need to make a huge number of assumptions about feedbacks to get to that, and it seems to me there are huge uncertainties about those feedbacks. You write:
And:
This seems to me to be very over-confident in the understanding we have of all the factors that can change global temperatures. Do you understand that many lukewarm sceptics just don't see the evidence for this confidence?
We're getting way off topic now. But I guess it's an old thread at this point, so maybe Bishop doesn't mind.
Jeremy Harvey -
No, I don't. The scientific evidence is quite strong on these subjects.Natural variability, for example, rarely causes more than 0.2–0.3°C surface temp warming over periods of a few decades. So to claim it's been double that over the past 30 years, while the oceans have also been warming, is just non-sensical. If the oceans were dramatically cooling then it would be a plausible argument, but that's not the case.
As for my statement about glacial-interglacial transitions and sensitivity, there are a number of papers on the subject (none I've seen by "skeptics" who think sensitivity is low, as I noted earlier). I discussed one here. Chris Colose has just drafted up another excellent one looking at a paper by Royer on the subject. It's not published yet, but I'll give you a preview if you're interested, here. All of these papers arrive at the same conclusion that to explain past climate changes, sensitivity needs to be near 3°C. I have a hard time believing that's just a coincidence, and a hard time understanding why some people aren't convinced by these many lines of evidence.
On this, I don't expect anything. I simply don't know enough about it. You?
That may well be temporary, as I've witnessed over the past five years. For this and other reasons, I favour no data set over another. Again, I don't know enough to make a competent determination. I've read about the reasons for the differences frequently over the last five years, but I still feel like I'm learning about that.
Don't quite understand this. Are you comparing the difference between two trends for the last three decades, to the projected trends til the end of the century/next few decades?
By all means, argue that case. If I had the skill, I would crunch numbers and see what fell out.
I see it as normal and inevitable in the different data sets measuring different quantities with different methods. GISS dominates for the last 30 years, but if you start from sixty or a hundred years ago, HadCRU trend is higher than GISS's. I wouldn't draw conclusions about the validity of a particular data set just because one is more different than others. What is striking, to my mind, is the agreement between all the data sets.
You've touched on a broader range of topics in your last post. Maybe we'll get to them some time.
I just realised I'm much more familiar with skeptics' views on the matter. I should go back and read Hansen and Trenberth on this more carefully.
barry
I've not come across any work that says that the surface warming trend and TLT should not be in good agreement. I will be interested to know if I am incorrect. Like you, I suffer from the endlessly-expanding reading list problem.
WRT the MMM vs observations, what I was trying to say is that if 0.14C/decade is close to the mark, then the 0.06C/decade difference from the MMM would yield a 0.6C undershoot in a century. I was simply suggesting that we shouldn't play down the differences between observations and the MMM as too trivial to matter.
WRT ENSO and TLT trend - no point in arguing about something we can't argue about without better information ;-) I will keep an eye out for more on this though. Interesting.
I'm still curious about why something we know - that TLT is more responsive to ENSO - should seemingly be contradicted by GISTEMP over the last decade.
Don't worry about the rest of what I said above. I wasn't after a direct response, just working through the various points.
Dana
Thanks for your thoughts.
One thing though:
I'm no climate sceptic, but by God I am a renewables sceptic. It's cloud-cuckoo-land from an engineering perspective, simple as that. 30% global energy mix by 2050 at the absolute best (my estimate is around 20% tops) at an opportunity cost so terrifyingly high we will regret it for ever more. Sorry to be so blunt, but I feel about renewables advocacy as you probably do about people refusing to accept the body of work explaining the physical properties of CO2.
It's nuclear or CO2. Which, I'm sure you know, is also Hansen's view. We all agree about something!
I pretty much couldn't disagree with you more about renewables :-) Rather than discuss it here, I recently co-authored a pretty detailed summary post on the subject. The comments there would be a good place to discuss it, if you'd like, so that we don't totally derail this discussion thread.
Oh I've also written one on the recent Google.org report that basically found we'd be economically stupid not to invest heavily in renewable energy R&D. If interested, you can view a preview here, but I'd prefer if you don't post in the comments on that one because it's not published yet. And of course Google has been putting its money where its mouth is on this subject, investing heavily in renewable projects.
Dang the link didn't work - here's the Google post
Dana
Thanks for the links. Let me have a read, and if I think I can offer constructive input, I'll comment on the summary post, as you suggest.
dana1981: The consistency between empirical data and models is only of relevance if the underlying physical processes and their interactions have been sufficiently well modelled; otherwise the consistency is merely a reflection of good curve fitting and therefore has no scientific relevance.
My two quotes from ‘Knutti and Hegerl (2008)’ suggest that the underlying physical processes are, indeed, not yet sufficiently well modelled and may well be the reason why current models indicate the planet could not transition between interglacial and glacial periods if sensitivity is low. It may also be the reason why current models seem unable to explain the transition back from glacial to interglacial?
Concerning uncertainty, my experience in life is that actions based upon uncertainty tend to have unintended consequences that may be much worse than the consequences of inaction. This is especially true when the subject of the uncertainty may, in fact, have some beneficial consequences; something that tends to be effectively ignored by CAGW proponents. Nevertheless, I’m not averse to considering the precautionary principle if adaptation is given as much weight as mitigation but, again, this isn’t usually the case when CAGW is being discussed.
Having said all this, I think the debate over sensitivity would be quickly resolved if the CAGW hypothesis could make some unique/unambiguous prediction; one that could be tested against real-world data that had not been used to ‘tune’ the models (i.e. verify/falsify it via the Scientific Method). The only example I’ve come across to date has been the tropospheric ‘hot spot’, though its usefulness as a unique signature and interpretation of the available data appear somewhat controversial. Nevertheless, I’m keen to find out if there really are scientifically testable predictions that would provide clear and incontrovertible proof… and that don’t involve waiting for a few decades or more to ensure a sufficiently good signal-to-noise ratio.
It's certainly possible that all the models and empirical data pointing at 3°C climate sensitivity are all wrong on the high side. It's also really darn improbable. I certainly wouldn't want to bank our future on it.
My big issue with those who oppose action is the assumption that it will have negative consequences. There are many reasons to reduce GHG emissions and fossil fuel consumption, even setting climate change aside, the economic benefits being towards the top of the list (i.e. see the Google link I provided for BBD, and this one). To me, the real alarmists are those who claim that reducing emissions will cripple the economy. There's actually a consensus among economists that we should reduce emissions.
There are many AGW 'fingerprints' - I discussed 10 here - but they can't tell us about climate sensitivity, just that the warming so far is mostly anthropogenic. Though I suppose from there you can use my calculations showing that the amount of warming we've seen is consistent with 3°C sensitivity.
Mostly a lurker here but I'll chime in to also welcome our SkS visitors who have done themselves credit. I just wish more Climate blog threads were like this, i.e. a (relatively!) polite debate about the contentious scientific points. That surely is what the majority want to see but it is soooo hard to find. I have really tried the pro-AGW sites (Tamino, RC) but they are so awful with a very bad case of Smartest Man in the Room syndrome and no alternative view allowed that they are virtually unreadable. If your case is strong then argue your case politely against all comers.
BBD as always covers the detail well, JeremyH makes some excellent points about over confidence and DaveS pretty much mirrors my position that hindcasting/curve fitting is very unimpressive when the poor projections (and yes they are poor) indicate we know far less than we think (i.e. there ARE things missing from the models).
It's that old Scientific method thing again. Hypothesis - Predict (FUTURE!) - Test. Stick with it and you won't go far wrong. OK the timescales make this a slow process but we've had 40 odd years now and I see little evidence that our understanding is within any reasonable bounds or even improving (perhaps because it is too focussed on the CO2 red herring).
Dana is frustrated that we sceptics don't accept his "evidence" (peer/pal reviewed scientific papers). I am frustrated that the pro-AGW guys don't see that the results of their labours (predictions) aren't very good and with an exclusively warm/apocalyptic bias.
But as I say, welcome and do please join in again. You have more chance of making converts here (if that is your aim) than preaching to the converted on highly moderated sites.
Hey I'll even go and have another try reading SkS to see if it's changed!
Simon - I have to disagree with your assertion of 'poor projections'. It just so happens we (by 'we' I mean SkS, but mainly me) are starting on a series to evaluate climate predictions/projections made by both 'sides'. Unfortunately there aren't a lot of 'skeptic' projections out there to evaluate, but those that have been made have been almost universally inaccurate from what I've seen, if you want to talk about poor projections. For example, the first entry in the series, Don Easterbrook. I also compared Lindzen and Hansen not too long ago. Hansen in 1988, granted was not perfect because his model was too sensitive (4.2°C), but had his model sensitivity instead been 3.4°C, he would have been almost spot-on. We'll also be examining some other projections starting in the '70s, as well as those in the various IPCC reports (which have been pretty good). You claim a universal warm bias, but actually the IPCC SAR (second assessment report) was biased too low, so that's simply not true.
dana1981: Good to hear that you are starting on a series to evaluate climate predictions/projections made by both 'sides'. However, if you accept the ‘null hypothesis’ approach to science, your emphasis should be to on the CAGW projections because the onus of proof lies squarely on their shoulders. Moreover, just because the other side cannot produce a credible projection does not mean that this proves CAGW but merely that they too do not yet have a credible answer; a situation that exists at the beginning of any scientific enquiry and is nothing to be ashamed of.
One projection that would be pretty hard to ignore would be one that begins in, say, 1990 and is based upon relevant empirical data up to, but not beyond, that date. I guess Hansen’s 1988 projections may be the nearest thing we have to this but, as you yourself admit, they need ‘retuning’ to align them with post-publication empirical observations, which makes their value somewhat questionable for this purpose.
Anyway, good luck with you project and I look forward to seeing the results.
Always a welcome sight - lukewarmers and world-savers getting together and patting each others' backs, agreeing about amicable discussion and "action" and the like.
I wonder why there is no scientific integrity on one side if everything is so simple and straightforward.
Thanks Dave. I disagree on the null hypothesis point though. If we had no knowledge of the workings on the climate system, then sure, the 'null hypothesis' would be that current changes have the same cause as past changes. But we now know quite a bit about how the climate works, and the evidence overwhelmingly supports the AGW theory to a degree that I think it clearly becomes the new logical null hypothesis.
As for "CAGW", that depends how it's defined. To me, CAGW is just the progression of AGW if we continue in business as usual or something close to it for several decades to a century. Basically AGW says if we continue to emit large amounts of GHGs, the planet continues to warm, and eventually the consequences become catastrophic. It's just a matter of when.
Regardless, I think AGW has more than satisfied the burden of proof, and I think if the 'skeptics' want us to delay acting upon it, the burden of proof is now on them, and the null hypothesis has changed.
Shub -
I'm guessing the folks you think lack scientific integrity aren't the same folks I think lack scientific integrity ;-)dana1981: Yes, the 'null hypothesis' would be that current changes have the same cause as past changes. That’s why the onus is on CAGW to first of all prove beyond reasonable doubt that current changes are, to a significant degree, caused by changes in the concentration of anthropogenic CO2. Correlation does not equal causation and extraordinary claims require extraordinary evidence. The enhanced greenhouse effect (i.e. CAGW) is, indeed, an extraordinary claim because it takes the basic mechanism of molecular absorption/emission of radiation (i.e. AGW) that is well understood by today’s science and amplifies it by means that are complex and as yet both insufficiently understood and scientifically unproven.
I’m nowhere near as convinced as you are that we know enough about how the climate works to say that the evidence overwhelmingly supports CAGW theory. Maybe its just that my knowledge of the subject is insufficient or that I’m just not bright enough to understand such a complex subject. However, when people like Freeman Dyson have their doubts, it suggests to me that CAGW proponents do not yet have all the right answers.
Sure Mr Dana, ;) and all that, our definitions of scientific integrity are in all likelihood mutually exclusive.
For example, I think selling products with a false interpretation of scientific literature emblazoned on it, lacks atleast some measure of integrity.
For the free pass you have at venues which do not censor your output, your contributions are like the following:
"The null hypothesis of climate change has been reversed".
Again, don't take this personally and use it as an excuse to evade discussion (although what cannot be helped, cannot be helped), but statements like yours only prove that you lack basic understanding of the scientific method. The null hypothesis is not whatever you fancy to be, or declare it to be.
Secondly, the "overwhelming evidence" in favor of AGW/CAGW is computer models. Please remember, there are those of us who are not overly overwhelmed by computer models as "evidence". Your standards for science may be low, but please do not assume them to be universally applicable. Nor is it for us, that enormous quantities of evidence are necessary, but a definitive demonstration of the quality is certainly necessary. Please excuse those of us who are not very moved by categorical bully pulpit statements as well.
That does not make us 'deniers' or ''skeptics''.
Shub
Come on. This is just inflammatory. Lukewarmers are almost as reviled as sceptics ;-)
Even so, witness the extended exchange of information above, achieved through being reasonably nice to each other.
@BBD, Shub
Whilst I have absolutely no problem with being nice to each other (I wish it was more often so) and I'm pleased to see some of the SkS guys here, I'm not sure any of us have actually learnt anything or read anything that will change our minds. John Cook left a couple of statements and went again without arguing them. dana1981 came, waved his hands a lot and listed all the stuff we've all heard a dozen times before without once conceding so much as a single millimetre. barry at least, though, seemed to take something away from his discussion with BBD, as it seems, did BBD himself (nice stuff by the way BBD). On the whole though, I don't think the conversation has been particularly productive. Maybe it's still too early yet. Maybe we really do have to wait for a few more years of empirical data before any of the various "sides" will be willing to give a little ground.
LC - I'm not sure you were paying close attention to my comments. Firstly, I didn't just "wave my hands", I provided evidence (in the form of links which discussed the issues in much greater detail) to support virtually everything I said. As for 'conceding', I conceded that there is substantial uncertainty remaining about a number of issues (i.e. cloud feedback, aerosols, climate sensitivity). I really don't think you're portraying my comments very fairly.
@dana1981
Actually, dana, I did pay close attention to your comments (notwithstanding my current lack of available time at any rate). However, on re-reading the thread, I withdraw my remark about hand-waving and I apologise. That being said, and I don’t mean to cause offence, but to keep referring back to your own SkS articles is hardly what I would call evidence. Direct links to papers would possibly have been better? On the one point I pull you up on (your “quick and dirty calculation”), your answer is to declare that warming over the last 40 years is “almost entirely anthropogenic” and that this is the IPCC‘s view. Now, putting aside for the sake of this discussion whether there is any justification whatsoever in such a statement and, equally, putting aside whether or not this is a correct interpretation of the IPCC view, “anthropogenic”, to me at least, means more than just our contribution to the level of CO2 in the atmosphere. Your discussion with BBD was about the climate sensitivity to CO2 forcing and your calculation was based on CO2 being wholly responsible for the warming seen. A pretty big leap. Earlier in the thread, in a comment aimed at spangled drongo you state “There's been ~0.6°C warming since 1960, and approximately 100% of that is anthropogenic“. So, by the time you reply to me, we’ve gone from “100% anthropogenic” to “almost entirely anthropogenic”. Later in the thread, when James P makes a comment on your “almost entirely anthropogenic” statement, you reply “What would be extraordinary would be if natural variability could cause a 0.5°C warming in just 30 years”. Again, ignoring for the sake of this discussion the period in the first half of the 20th century where the rate of rise was very similar, I note you are careful to use the term “anthropogenic” in almost all of your comments (apart from the one where you make your little calculation) and you make no attempt to quantify how much of the 0.6C rise you think is due to CO2 itself and how much you think is due to other anthropogenic causes. So, is there, in your view, any natural variability element to that 0.6C? How much is CO2 driven and how much is down to other anthropogenic causes?
Yes, it is a glaring omission.
barry: Absence of evidence is not evidence of absence. As I said before, just because the other side cannot produce a credible projection does not mean that this proves CAGW but merely that they too do not yet have a credible answer; a situation that exists at the beginning of any scientific enquiry and is nothing to be ashamed of.
For example, can high sensitivity also explain the transition back from glacial to interglacial and, if not, should we also consider this a "glaring omission"?
The early part of the 20th century - the steep rise from ~1910 to 1940 - had a strong positive solar trend, and IIRC, estimates are that this could have accounted for as much as half of the temperature rise for that period. Although it seems volcanic forcing contributed, data for this metric is less certain in the early 1900s than for solar. IPCC Ch 9 summarises the then state of knowledge on natural forcings.
Hi Dave,
Yes. The amplitude is the same (5C). Makes no difference to sensitivity whether the temperature change is warmer or cooler.
The range of climate sensitivity estimates over the last 100 or so years is 0.25C - 10C, converging in the last few decades. I wouldn't call 3C 'high'. Arrhenius calculated 5.5C, IIRC. That seems high to me. Guess it depends on where your middle is.
The mean of that range, BTW, is 0.28C. Not scientific, but it does make me wonder why some people base their 'middle' on a few outlying estimates at the bottom of the range.