


 Bishop Hill
 Thou shalt extrapolate
Climate: Surface John Cook, of Skeptical Science fame, has an article in The Age, in which he is very rude about Bob Carter:
A Yiddish proverb states ''a half truth is a whole lie''. By withholding vital information, it's possible to lead you towards the opposite conclusion to the one you would get from considering the full picture. In Bob Carter's opinion piece on this page yesterday, this technique of cherry-picking half-truths is on full display, with frequent examples of statements that distort climate science.
One bit of the article that stuck out at me was this:
[Carter] has long hung his hat on the proposition the climate has been cooling since 1998. But with 2005 and 2010 being the hottest years on record, he resorts to cherry-picking which dataset to use. Rather than use temperature records that cover the entire globe, he opts for datasets that do not include the Arctic region, where warming is the strongest. These temperature records underestimate recent warming and are the darling of those who wish to deny global warming is happening.
Now this is interesting. As readers here know, there are almost no temperature stations in the Arctic and the gaps are therefore infilled by extrapolation.
 Now, I don't know about you, but I'm not sure that it is reasonable to get on one's high horse complaining about somebody who prefers to look at, you know, actual data rather than the outpourings of a mathematical model.
Certainly, to accuse them of half truths seems, well, extreme.
Reader Comments (226)
I've just re-visited the decadal trends 1998 - present, and this pretty picture shows:
Decadal trends 1998 - present (degrees C):
HADCRUT3 0.0 (0.000 p/a)
GISTEMP 0.1 (0.011 p/a)
UAH 0.0 (0.004 p/a)
RSS -0.03 (-0.003 p/a)
dana1981 - Jun 28, 2011 at 4:50 PM
Should you choose to start your article with "Cherry-picking the evidence to suit a pseudo-scientific argument misses the alarming reality. " I'm not clear why you think Lubos and the 104 point reply is not relevant to the article in question.
The underlying theme of his reply to the 104 'points' is that Cook, as with many in the climate change industry, has a tendency to ignore that which doesn't fit 'the narrative' and wave through, however flaky, that which does. The Argo network is error ridden whereas we can safely use a reanalysis product based on some guy throwing a bucket over the side of a ship decades ago. Tree's are good when they tell us what we want to hear but 'divergent' and need to be hidden when they don't. Greenland is a poster child for AGW until we dig out an ice core or two ... now Greenland is a small landmass that is irrelevant on the global scale. Need I continue?
"each of which is a half-truth at best", Cook or Carter? OK, I figure you are talking "Bob Carter and his deliberate brand of climate cherry-picking". "But with 2005 and 2010 being the hottest years on record, he resorts to cherry-picking which dataset to use." Not that Cook would resort to using "NASA Goddard Institute for Space Studies and the European Centre for Medium Range Weather Forecast " to prop up his POV. Hansen and the European ETS astroturf project... ya got me there. Frankly, I really can't be bothered with the rest. Read the "article attacking Skeptical Science" for more.
See above (GISS and EU carbon trading astroturf) and ... if you want to bring up climategate, at least read the bloody things (they are available on a net connection near you)
"the Arctic is the fastest-warming region of the planet's surface". Most of the Arctic is covered by ice and the rest has very little in the way of instrumentation. But let's suppose that you are correct. So what? (GISP2 ) (and yes I know 50,000 years is just weather not climate)
Again ... so what? What would satisfy you, warming, cooling ... heaven forbid, climate stasis! Back to Lubos... go and read it.
A very relevant post on Jennifer Marohasy's blog:
"The greenhouse effect as characterized by the normalized greenhouse factor has increased by only 0.19% from 1960 to 2008. The temperature change from 1960 attributable to AGW is less than 0.1 C. The extrapolated temperature change attributable to AGW at doubled CO2 concentration is 0.26 C. The data shows that the IPCC estimate of climate sensitivity at doubled CO2 concentration of 3.0 C is unrealistic."
http://jennifermarohasy.com/blog/2011/06/outgoing-longwave-radiation-and-the-greenhouse-effect-ken-gregory/
golf charley -
Yes they have. Sea level in fact has risen towards the high end of IPCC predictions. Temperature is very close to the middle. From some of you, yes. On the whole, not even close. But we have thick skins.BBD - not sure what you're looking for in terms of a response. OHC data remains problematic - I'm content to wait and let the experts sort it out. It took climate scientists a long time to get Spencer and Christy's UAH data right, as you may recall. New instruments and new data - the bugs will eventually get sorted.
Not sure what you mean about us both talking about OHC.
spangled drongo - can't say I'm excited to read a Friends of Science document. Maybe I can stomach the courage the courage tomorrow. Seriously though, climate sensitivity is 0.26°C? Give me a break. That's ludicrous on its face. If climate sensitivity were anywhere near that low, we'd still be in the last ice age.
"we are too busy at skepticalscience to address Lubos Motl"
Too busy doing what? Shrinkwrapping global warming articles, isn't it? Mr Dana?
Here is a challenge:
Since your boss John Cook did not take up on his claim that the Anderegg paper does not support that he put on a T-shirt and is actually making money off of it (for himself, I don't know), why don't you do it?
I want to see what clever evasive maneuver you'll come up with, to try to insult those who ask you a question, and at the same time run away.
Tell me how Anderegg et al supports the conclusions your abode ss.com sells t-shirts of?
Just give it a try. I am sure it must easy for someone who works at a private company cleaning up environmental spills and takes on Richard Lindzen in his spare time, to come up with some explanation to something as simple as this.
Alexander K
Stewart Lee was being ironic - at many levels - in his video clip there (it was his end joke coming at the tail of a long piece). Lee is probably the best comedian in the business today. Brilliant.
Dear Mr Dana
You use of "you" and "us" and "we" in your response to Golf Charley above is amusing.
Please drop this middle school level of interaction, drop your baggage, your buddies and bum pals - "we" don't do things this way.
Shub - I tend not to respond well to rudeness. In fact, I tend not to respond to it at all. Be advised, any future rude comments will simply be ignored.
It always surprises me when people deny the scientific consensus on AGW. There's Doran, Anderegg, Oreskes, Peiser (a "skeptic" who in trying very hard to refute Oreskes' results actually ended up confirming them), and so on. You can nitpick any individual survey or study, but the fact is that they all arrive at the same conclusion for a reason. The consensus is real. Now, you can argue that the consensus is wrong - it's certainly a possibility. But arguing the consensus doesn't exist is just denial.
dana1981,
Actually, current global temperature is what it was in 1983 and that is around 0.3 c above 1960 levels.
http://www.drroyspencer.com/latest-global-temperatures/
How much of that 0.3 c would you put down to ACO2 and how much to natural variation?
Always bearing in mind that if these temperatures were taken to the nearest whole number we would be looking at a simple horizontal line.
And while we're looking at Roy and talking climate sensitivity, check this:
http://www.drroyspencer.com/2011/06/more-evidence-that-global-warming-is-a-false-alarm-a-model-simulation-of-the-last-40-years-of-deep-ocean-warming/
"Yes they have. Sea level in fact has risen towards the high end of IPCC predictions. Temperature is very close to the middle."
dana1981,
Have you ever put your head out the window and checked?
I have a sea-wall that I built to highest astronomical tide levels in 1963 and those yearly HATs today come to a point 100 to 200 mm [4 to 8 inches] lower than 48 years ago.
spangled, let's please not start cherrypicking individual months. It's bad enough to cherrypick 1998 as a starting point, and that's a full year. There's been ~0.6°C warming since 1960, and approximately 100% of that is anthropogenic.
I'm not really interested in Roy Spencer's "simple models". He has a very bad track record with them.
And no, I don't get my sea level measurements from looking out the window. I get them from satellites and tide gauges.
"There's been ~0.6°C warming since 1960, and approximately 100% of that is anthropogenic."
Dana, check your own graph on that. The actual difference is 0.1 c. But OK, have it your way. How do you know that 100% of that is anthropogenic? Is it not possible that what caused earlier, greater warming could be causing current warming?
And when it comes to models, Dr Roy is no guiltier than Hansen or any of the warming persuasion.
If you want reality as opposed to virtual reality then I suggest you look out the window. For every one of those ridiculous satellite graphs I can provide a study of tide gauges that decimates their results.
However watching sea levels at a benchmark over nearly half a century really brings home the message, much more than anyone's extrapolations ever can and as a result I can only confirm that people like Nils-Axel Morner have a very good feel for what's really happening.
"[Arctic is] only the fastest warming in Giss because they extrapolate from nearby stations"
Satellite temp records, which cover much of the Arctic since 1979, show the decadal warming trend there is 3 times greater than for the globe.
Global temperature trend - 0.14C/decade
Arctic temperature trend - 0.48C/decade
The source is from 2 prominent skeptics, Roy Spencer and John Christy.
http://vortex.nsstc.uah.edu/data/msu/t2lt/uahncdc.lt
(go to the bottom of the page for trends)
Plenty of evidence backs up a faster warming rate in the Arctic, not just satellites and extrapolation. There is NO substantive evidence for an alternative conclusion.
IPCC (2000/2007) sea level projections are lower than obs.
Recent global temps are in the lower part of the range of middle-scenario model runs specifically for IPCC, and last year's global temperature anomaly approached the mean projection. So far, the observations do not fall outside IPCC projections, although 2008 was close to bottoming lower than the range.
Why are you so confident in 3c being CO2 climate sensitivity, when there is no observational evidence to back up your point? What has happened in the last 10 years to make me concerned?
Sorry, the last para was transported by mistake. but I might as well have a go answering it.
Climate sensitivity papers are essentially rooted in observations. The modeling is built around it. There is no way to establish climate sensitivity without applying some mathematical constructs (which is what models are) to the data.
Sometimes the title of the study makes it clear:
Solar-Cycle Warming at the Earth’s Surface and an Observational Determination of Climate Sensitivity – Tung & Camp (2007)
Using multiple observationally-based constraints to estimate climate sensitivity – Annan & Hargreaves (2006)
I think perhaps the author of the above quote is unfamiliar with the subject. Those two papers and many others on how climate sensitivity is derived can be accessed at this helpful page:
http://agwobserver.wordpress.com/2009/11/05/papers-on-climate-sensitivity-estimates/
If one were to take climate sensitivity papers and work out some kind of 'mean' just from their results (not in the least bit scientific - just for interest's sake), according to Barton Paul Levenson:
"the mean is 2.86, and the sample standard deviation is 1.50"
http://bartonpaullevenson.com/ClimateSensitivity.html
I'm a bit late to the discussion, but anyway.
Talking about half truths..
J Cook:
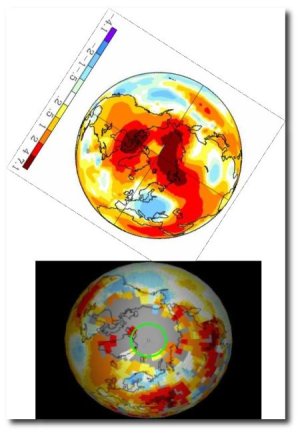
this image shows the reanalysis temperature for the North Pole. It is the NCEP reanalysis, but it shouldn't be too different from the ECMWF. There is a net warming trend, sure, but it is only half the truth, unless the initial cooling trend is explained, and why it is very well correlated with the decrease in number of recording stations. A constant increase in CO2 and an oscillating trend in temperatures need further explanation.
barry above says:
Again, it is only a half truth, from the UAH satellite record, this other chart shows a decreasing trend from 1978 to 1995 and a warming trend afterwards. We need to explain the oscillations to understand how the temperature behaves and in response to what. Besides, it is not the faster warming, at least not according to the heavily homogenized ZAMG temperature records of the Alps.
sorry "fastest" instead of "faster", second line from the end
So,your Grace,that was a hearty endorsement of Carter's highly selective use of data,indeed. Care to comment directly on Carter's "facts" and in which situations you might endorse his technique? Tell us how and why an article like Carters advances ,or even maintains or diminishes, understanding?
Would you find the space in an op-ed to mention all the global temperature data sets when making Carterish claims,or avoid the situation altogether?
Ooo tag team! John, Dana, Barry. Great to see you wrestling here.
Dana, JC
As 3x2 says, "What would satisfy you, warming, cooling ... heaven forbid, climate stasis?"
In other words, how do you falsify Climate Doom, when whatever happens is ascribed to it?
Nick @ 9:32am, that's actually an interesting question. Obviously it's impossible to include everything in a 1000 word opinion piece. So what is the difference between a claim that diminishes understanding and one that advances understanding? The claim that advances understanding is one that is consistent with the conclusion you get from looking at the full body of evidence.
For example, take the argument that CO2 has been much higher in the Earth's past without our climate experiencing runaway warming, implying that CO2 doesn't cause much warming. That argument gives you half the picture. The full picture is that as you go further back in time, the sun gets cooler. Without the warming effect of those elevated CO2 levels, the planet would've been a frozen ice ball back in the deep past. So in this case, the half-truth drives you to the opposite conclusion you get from considering all the evidence.
Dear Mr Dana
You don't respond well to rudeness? Well, when someone with a minimal understanding of the scientific method, and the potential pitfalls in logical inference passes judgment on others' understanding, I consider that rude. Do you think your posts are devoid of such a slant?
In any case, since the rudeness distracts you, I'll indulge in politeness.
Could you please tell me how the Anderegg et al paper support the conclusion that "97% of climate experts support the consensus position"? Please mind, that conclusion may be at least superficially defensible, in and of itself, but my question is as to how the Anderegg et al paper supports this conclusion?
Please allow me to inform you, that citing many papers to support a conclusion may turn out to be a problem, if they are cited inappropriately.
I can repeat my question if you like.
If no meaningful replies are forthcoming, please consider ss.com 'debunked'. I would then request you to kindly strike that one item off your list ( I believe you have one).
Barry @ Jun 29, 2011 at 9:00 AM
http://bartonpaullevenson.com/ClimateSensitivity.html
Please tell me why I would want to spend any time at Barton's site, when it's home page carries the inciteful link to his Climatology papers and i quote word for word:
My Climatology Pages: I explain some Climate Science, and bitch-slap the global warming deniers
(http://www.bartonpaullevenson.com/)
What a thoroughly charming man BPL must be. May I suggest you read nothing that uses the D word, or other ad-homs such as watermelon, global warmonger etc etc. Thank you for the link but no thanks.
Selective responses Mr. Cook? Bad form Sir, your outlandish claims require further clarification.
"So in this case, the half-truth drives you to the opposite conclusion you get from considering all the evidence."
Have you considered Liu et al? Because in this case, your half, nay zero, truth argument regarding CO2's benefit to plants being outweighed by "these other [climate] effects" is plainly falsified, as is your claim the Sahara is not shrinking.
Try taking your own advice for once Sir. "investigate and consider the full body of evidence"
John Cook
You mean the way it was in the Late Proterozoic?
The points I have made earlier in this thread re climate sensitivity have not been addressed. Talking over an argument is not the same as joining it.
Patagon, I just ran a straightforward linear regression on UAH 1978 - 1995 data and got a positive trend. I don't know the provenance of that graph, and I'd recommend doing the job yourself before referencing it.
Now, to make the apples to apples comparison, the global trend for the same time period from the same data set is half that of the N Pole trend.
Crunching the numbers myself, the conclusion is that the Arctic has warmed faster than the globe for the period you nominated.
I think the point you raise about the sudden jump from a smaller trend (to adjust the concept) to a huge one is indeed interesting, but I would not propose some kind of oscillating as more likely than non-periodic fluctuations, unless there was a very good basis for doing so. With the UAH data, there does not seem to be enough information (not a full cycle), to determine this, no matter how well other indices may correlate. Still, it's a possibility.
BBD, I have asked JC and Dana a few times for some observational data, that I can see, to confirm why sensitivity is 3c, when the theory says that CO2 can only raise temperatures by 1c
Have you seen anything observable?
Does anyone else wonder how John Cook's site has reached such apparent prominence in the AGW debate in just a couple of years.
According to his website, prior to SkS, John and his wife eked out a living with her doing web design work and him child minding and drawing his sci-fi cartoons.
The he got the AGW religion - and started collating scraps from warmist papers.
Suddenly, a couple of years later, he's got a team of "helpers", a very sophisticated website with translations into nearly 20 languages, a couple of books published, a string of professionally produced software apps, a travel budget that enables him to fly around giving lectures and enough manpower to mount round-the-clock "love-bombing" raids on sites like this.
All this from a site that is, apparently, "self financed from Paypal contributions only".
I've noted that his chief sidekick "Dana" is a full time employee of a large US environmental consultancy group.
He thanks an Australian software company, Shine Technology for producing his Iphone , Android and Firefox applications - all apparently free of charge.
According to their website, Shine's main customer base are Australian gas and electricity supply companies.
He also thanks a guy called Jean-François Barsoum for his Nokia app - who happens to be in charge of "Green Technologies" at IBM Canada, as well as being on the board of Davis Suzuki's foundation.
The Bish must know what a long and hard road it is to bootstrap a site like this one up to it's current level of prominence without external funding.
I wonder if he would agree that somebody with a lot of resources is hovering in the background at "Skeptical Science".
Not wishing to seem sceptical of course.
And parts of the Antarctic Peninsula is warming faster than both. But the comparison is not apt, as these are quite localised areas compared to the broad expanse of the Arctic, that UAH measures - 60N - 82.5N. There are plenty of local areas warming faster than the global average. In any case, the Alps temps are included in the HadCRU temp record, but the Arctic isn't.
But this is tangential to the point. The period of interest is Carter's - 1998 to present - which even in the puzzling graph you cited shows a much greater warming in the Arctic than the rest of the globe, reinforcing the point that Carter has favoured a temp record that is missing some heat.
Foxgoose is a good example why I can't stand to comment on blogs like this for any lengthy period of time. The comments always devolve into personal attacks.
For the record, everyone who contributes to SkS does so pro bono. The reason we're willing to do this is because John put together such a great site, which he did on his own dime, aside from some minor paypal donations. As it so happens, John has had a difficult time expending so much effort on SkS. I won't divulge any more because it's his personal life, and frankly none of anyone's business. But to depict John as some sort of playboy on the AGW gravy train flying around and lining his pockets with cash is about as far from the truth as you can get, and really pisses me off.
Other commenters - if you want to continue with a civil discussion, I suggest you ask Foxgoose et al. to cease with the personal attacks and conspiracy theories. I have no desire to continue commenting here if this offensive behavior is to continue. I think we've put up with it for long enough.
......to depict John as some sort of playboy on the AGW gravy train flying around and lining his pockets with cash........
I didn't say that - you did.
Methinks you protest too much.
Clearly the funding of SkS is a sensitive topic.
Dana, wholly agree, and thanks for sticking with it, much appreciated.
Now can you answer BBD?
"The points I have made earlier in this thread re climate sensitivity have not been addressed. Talking over an argument is not the same as joining it."
Sorry for shouting - HTMl glitch
Josh; Dana
I would suggest more that you skated round the hard bits. But I am perfectly happy to have a civil disagreement. And I leave it to others to ponder who made the more convincing argument.
barry
How do we account for the difference in trend for GISTEMP 1979 - present and UAH? (Or RSS, come to that?)
As you know, GISTEMP has a decadal trend of 0.16C compared to 0.14C for UAH.
Does incomplete high latitude coverage in the UAH reconstruction account for the noticeable difference in the two trends?
Or is GISTEMP's estimation of Arctic temperatures by interpolation the significant factor? Or both?
This isn't a silly trick question. I am genuinely curious if there is anything in the literature that examines this and seeks to quantify the cause(s) of the difference between the two records.
Note - agreed on Arctic amplification, so don't feel the need to defend that corner again.
Ok, dear Mr Dana,
I take it then, that you do not have a response to why skepticalscience's contention that Anderegg et al supports the claim - "97 out of 100 climate experts agree we're causing global warming", is unsubstantiated. I wouldn't hold you too much to it though, Mr Dana. It was not your claim to begin with. Nor am I going to suggest that all your arguments be dismissed on this count either.
ss.com makes money off this claim - t-shirts, coffee mugs and a 'range of other products'. Let me quote John Cook,
The message, let me remind you once more, is printed on the merchandise the website sells. It is not supported by the peer-reviewed literature the website cites. Indeed, *this* is a blatant example of distortion of scientific literature for commercial gain.
Secondly, I had indeed noted earlier that you seem to have a strange understanding of the concept of 'climate sensitivity'. Sensitivity of the climate is defined only for its response to CO2. There is no inherent sensitivity of the climate (without specifying the purported independent agent that influences it). You have, on the other hand argued, if I am not mistaken, that a warm Medieval Warm period implies a 'high climate sensitivity', without qualifying this characterization any further. This is a major flaw in your understanding of basic climate concepts and I hope you are able to address such defects (before resorting to exhortations of others).
BBD - you've been quite civil in your comments, so I suppose I shouldn't hold the behavior of other commenters against you.
It's really not a terribly big difference. Personally, my opinion is that the UAH and RSS data analysis methods aren't perfect. There have been a number of studies suggesting changes to their processes which would result in larger warming trends (i.e. Vinnikov and Grody, Fu et al.). Satellite temperature measurements are tricky.Shub - I'm trying to stay on topic as Bishop Hill requested. But yes, a strong MWP (and large natural variability in general) means climate sensitivity is high. There is nothing magical about CO2 that the climate should be less sensitive to its radiative forcing than, say, solar radiative forcing.
Dana
Thanks for the links. I can understand why Spencer might be resistant to critiques of the methodology that would increase the warming trend. I cannot understand why RSS would. Nor why it would miss another opportunity to embarrass UAH. I can understand why you might advance this argument.
I don't find it especially plausible.
Well that's debatable. Your earlier discussion of transient climate sensitivity hinges on the multi-model mean referenced in AR4. This projects 0.2C/decade 1979 - present.
UAH and RSS show 0.14C/decade for this period. GISTEMP shows 0.16C/decade.
I am interested in the confidence in the current estimate of climate sensitivity to a doubling of CO2, so this sort of discrepancy attracts my attention. I think this is preferable to waving it away.
Dear Dana
The topic of discussion is the 'cherries' in climate science, isn't it? It is also true that John Cook, of his own accord, raised the issue of Anderegg et all, isn't it?
The use of Anderegg et all to support a contention as is found in the Skepticalscience Store is a relevant topic since it is a formulation of a conclusion from a paper in the peer-reviewed literature to support a specific claim. Why,...it is exactly analogous to what Cook's accused Carter of doing - 'distorting' the literature to suit one's own ends.
Again, as I mentioned above, your overarching grasp of the concept of 'sensitivity' does seem tenuous.
A 'large natural variability' or a tendency of the climate to exhibit large variability, automatically means that confident attribution of a major portion of the warming that has been observed in the global averaged temperature in the second half of the 20th century, to anthropogenic carbon dioxide, is not possible.
BBD, hi.
I can only offer bits and pieces. RSS has a more similar trends to the surface data sets (for the 1979 to present period). I don't know why UAH is an outlier here, except that their methods differ from RSS while they use the same data.
I don't think there are many (any?) studies on differences between satellite and surface records, as each are measuring slightly different quantities and have quite different issues. However, their independence provides some helpful constraints and corroborations on general trends. Some things I know about satellite temps v surface records: lower troposphere satellite measurements are measuring radiance changes from the near surface to a height of some kilometers, while the surface records are taken at about 2 meters from the surface over land, and at sea level in the oceans. ENSO is amplified in the satellite records, both the positive and negative phases, meaning you need a few more years of data than surface records to get a statistically significant trend. Over time, the satellite records, particularly UAH, have become more congruent with the surface records. UAH showed almost no trend until 2005, when errors and oversights in computation were brought to the attention of Spencer and Christy.
However, while I appreciate your curiosity (it's refreshing, actually), and would research and chat amiably about this with you, we're beginning to stray from the topic.
barry
Thank you for your response. BH said let's keep the discussion to temperature records. I think we should be okay. If not, my fault entirely.
A few things:
This is puzzling. My understanding is that far from UAH being an outlier, it is virtually identical to RSS and both exhibit a trend of 0.14C/decade 1979 - present:
UAH and RSS. Common 1981 – 2010 baseline; trend.
You add:
I should have been specific - I'm referring only to the 600mb (14,000ft) TLT measurements from Aqua ch5. At this relatively low altitude, I would expect good agreement in trend with the surface boundary layer.
I am aware of the exaggerated response of the TLT to ENSO relative to the surface but puzzled by why this should require a few extra years' data to yield a statistically significant trend. As you say, the effect is symmetrical so presumably self-cancelling when calculating trend?
Finally:
I know what happened in 2005. It has no bearing now. The very close agreement between RSS and UAH should settle that.
While UAH post-2005 is indeed more congruent with the surface records, it has a 0.14C decadal trend (like RSS) 1979 - present. If there is an outlier in the four records compared below, it is GISTEMP, surely?
HADCRUT, GISTEMP, UAH, RSS. 1979 – present; common 1981 – 2010 baseline; trend.
Decadal trend (degrees C):
GISTEMP 0.16
HADCRUT 0.15
UAH 0.14
RSS 0.14
Anyway, it is interesting (though frustrating) to learn that the difference in trend between GISTEMP and UAH TLT is open to question.
To clarify, as of a year or two ago, UAH was the clear outlier. I believe RSS had a trend of 0.16°C/decade while UAH was 0.13 (surface temperature sets were around 0.17–0.18). Since then, UAH has trended hotter than the rest for whatever reason, and closed the gap. Now it's 0.14°C while RSS is 0.15°C (HadCRUT is also about 0.15, GISS is about 0.165, NCDC is close to GISS, I believe). This is why I said there's not really much difference between them all, and I also suspect the measured satellite trends are lower than the actual trends.
I just wanted to thank ‘dana1981’ and ‘BBD’ for debating CO2 sensitivity because this is really the crux issue for CAGW.
What strikes me about this debate is how much uncertainty there still is over how the basic data can interpreted and, more importantly, the way these uncertainties tend to be ignored if they fail to support a particular hypothesis. This sort of reinforces the message I got from reading the AR4 reports, since WG1 contains some quite candid statements about the degree of uncertainty over the effects of clouds, which are acknowledged to be one of the biggest influences of global temperature, that are effectively ignored by the other working groups.
Given this situation, I remain to be convinced of CAGW’s validity and therefore find it hard to understand how any one can say that the scientist is sufficiently well settled to form the basis for global policies whose impacts are likely to be both significant and detrimental (e.g. bio-ethanol).
As my first degree was in physics, I’m a big fan of Feynman and a great believer in his approach to science, which is why I appreciate hearing from both sides of the debate. Unfortunately, when I read sources that purport to present the science but fail to highlight the significant uncertainties, I come away thinking that science is been prostituted in the name of political correctness… and that Feynman must be spinning in his grave.
Dave Salt - yes, climate sensitivity really is the key to the whole climate 'debate'. I wish we could move beyond arguing whether the planet is warming and whether humans are causing it, and focus on key issues like sensitivity and aerosols and cloud feedbacks.
I agree WG1 is very candid about uncertainty. They put climate sensitivity likely between 1.5 and 4.5°C for 2xCO2. If it's anywhere in that range, we're in trouble, giving the rate at which our emissions are increasing. I don't know how you define 'CAGW', but continuing with business as usual will result in something between bad and catastrophic consequences (inclusive). The most likely result of business as usual is really, really bad.
Carter did not say it has cooled since 98, what he said was...
"Fact 1. A mild warming of about 0.5 degrees Celsius (well within previous natural temperature variations) occurred between 1979 and 1998, and has been followed by slight global cooling over the past 10 years. Ergo, dangerous global warming is not occurring." http://www.theage.com.au/opinion/politics/an-inconvenient-fallacy-20110626-1glmu.html
Now I'm not sure that makes much difference to the debate, but I'm very tired of the half truths, and zero truths, emanating from Mr Cook who clearly failed to quote Mr. Carter accurately, or indeed link to his article. I therefore felt the need to correct the record.
Did Mr.Cook get anything correct in his piece? I can't bring myself to read so many zero truth statements again, besides there being little point if Mr. Cook is continuing the internet version of sticking his fingers in his ears singing La la la la la I can't hear you .
What's the score so far, 3-0 to Carter with one draw?
Ha!
"I wish we could move beyond arguing whether the planet is warming and whether humans are causing it, and focus on key issues like sensitivity and aerosols and cloud feedbacks."
made me chortle, as I suspect it does many. Yes, those are the key issues. So why is it so 'alarmingly bad' when it, like, clearly, from the data, isn't. This I suspect is the real puzzle. How you manage to see what you see from the data and conclude what you do. To the rest of us it just looks like natural variation, or at a pinch natural variation plus.
dana1981: Yes, WG1 did put climate sensitivity likely between 1.5 and 4.5°C for 2xCO2 but I note that this is based upon analysis of climate model ensembles and the way that they behave under different assumptions.
Now, although this may well be a sensible approach, it does assume that the models capture all of the physical processes, along with all of their interactions, to a sufficient and necessary degree. However, given the level of uncertainty over the impact of things like clouds and surface vegetation – factors that IPCC openly admit could have a major influence on model behaviour – I do wonder just how much these uncertainties could alter their estimate of climate sensitivity?
Dave Salt - no, the IPCC sensitivity range is based on both models and empirical observations of past climate changes. See here. All estimates overlap in this 1.5 to 4.5°C range.
"The most likely result of business as usual is really, really bad."
Because Doom sells.