


Thursday
Jan132011
by  Bishop Hill
Bishop Hill Brisbane flood history
Climate: WG2 Thanks to readers who have pointed out Brisbane's flood history:
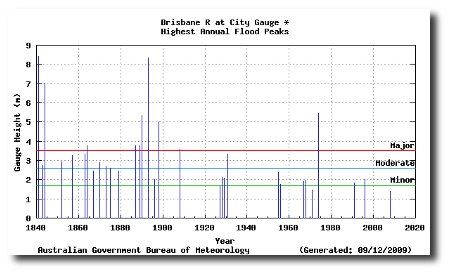
According to the BBC the flood gauge peaked at 4.46m, which makes it big, but smaller than some floods in the past, and much smaller than the megaflood in (I think) 1894.

Reader Comments (36)
What is the effect of the dams and stuff that they put in post 1974?
i.e. How big would this one have been without it? How comparable are these numbers?
It's the obivous warmist rebuttal, but does it.... errrmmmm...... "hold any water"?
I'll get my coat.
According to the chart it is the 7th highest flood on record (in 170 years). Eyeballing the chart, floods are getting less frequent and less severe. But not a thing of the past (unlike snow in winter)!
The Independent finding an angle...
Floodwater threatens overwhelming damage to Great Barrier Reef
Really... total garbage...
... and if the crown-of-thorns starfish eats the coral every 30-40 years, then that is part of the the life cycle of the starfish and coral.
My concern would be if the flood did NOT happen. What negative effect would that have on the reef.
Why is crap rammed down our throats continuously?
Sensitive stuff this coral. only lasted a few hundred million years or so...
And yes I have sailed and snorkled around the Barrier reef, and yes I do appreciate and understand its beauty and wonder...
Yes, but those are just measurements.
We need massive computer models run on massive computers to tell us what the real story is, i.e. runaway post-tipping-point apocalyptic immediate irreversible man-made climate catastrophe.
Easy enough to run a Fourier analysis on this and see that there is a periodicity around 40 years:
2011, 1970-74, 1930-34, 1887-93
The flood history map is interesting because the warmist camp could have used such data to continue to argue that due to global warming the severity and likelihood of such floods have receded not increased. Queensland is getting drier.
Instead, in this instance, the warmists have abandoned that stance. We see warmists now arguing that global warming means increased precipitation in this part of the world. Queensland is getting wetter.
The truth is that what a previous generation of Queenslanders learnt from the 1964 floods was not heeded by the present generation. Only the Wivenhoe Dam, built partly as a flood mitigation strategy after the 1974 flood saved Brisbane from worse flooding this time.
Mac observes:
So highlighting the alarmist tendency to seize on any disaster and clamour about climate catastrophe, even if that means contradicting a previous position.
This is what it means to be 'alarmist'.
Pitiful, really.
This is interesting time-series data, but what hydrologists do with this data is use Gumbell Probability Distribution (or some other similar) to fit a distribution which allows them to establish the 50-year, 100-year, and perhaps 500-year floods or even 1000-year floods. These then become the basis upon which designs are made for flood control investments and flood plain management.
It will be interesting to hear what basis they used in Australia for their flood control projects and how they managed the flood plains.
The disaster, as with all climate-related events, owes as much to human action affecting impact. Indeed, human actions always affect both hazards and sometimes even frequency. (If risk = hazard x frequency – a simplification — that does not mean that frequency is independent of human actions).
Interestingly, The Australian this morning carried a story that the City Council (under a previous mayor) had both ignored and suppressed a report drawing attention to fault in their planning scheme that was allowing houses to be built on flood plains on the assumption that floods would be 1-2m les than the engineers thought prudent. See:
http://www.theaustralian.com.au/news/nation/alarming-report-on-risks-covered-up/story-e6frg6nf-1225986634328
The Australian is a Murdoch newspaper, so of course we can ignore that! (Sarc off).
Note that this story includes some interesting data. The 2011 flood peak at Brisbane was 5.2m (5.45m in 1974). The peak at Ipswich on the Bremer River (a tributary of the Brisbane River that lacks the flood protection of Wivenhoe Dam) was 19.5m (20.5m in 1974). The worst of the flash flooding on Monday appears to have been in the Brisbane catchment, so it may be that Wivenhoe served some purpose in mitigation.
The suggestions by David Karoly and David Jones that anthropogenic climate change has exacerbated extreme weather events such as this are undermined by the historical record: the 1893 flood peak figures are 8.35m for Brisbane and 23.5m for Ipswich. The 2011 floods would seem to be consistent with (as climate scientists would put it) 1-in-100 events. But they are not exceptional, and come at the end of an unusually cool year in Australia (though we know cool is the new global warming).
The local newspaper also carried a report that the discharge from Wivenhoe was increased on Tuesday evening, which seems a little late, given that the flash flood at Toowoomba in its catchment came at about noon on Monday. While designed for multiple use, the dam is operated by the water corporation, and one wonders whether they were more interested in maximising catchment yields for water supply (so that they could defer their costly desalination plant) rather than maximising the flood protection capacity of the dam.
This should not have been a surprise. Most of the deaths have been the result of the flash flooding in the Brisbane River catchment, which no dam would have prevented. (The national disaster notification system – put in place after the 2009 fires in Victoria failed, and gave notice of the danger 6 hours after the event, but that is another issue). But all the figures indicated a substantial La Nina, with the December Southern Oscillation Index a record. At a minimum, they should have been expecting a substantial monsoon. Why then was the storage not emptied out to maximise its ability to manage the flood?
It played some role, in managing flows. Water releases from Wivenhoe Dam were reduced from an overnight peak of 645,000 megalitres per day on Tuesday night to 205,000 megalitres per day on Wednesday as the peak approached.
See: http://www.couriermail.com.au/news/queensland/wivenhoe-dam-water-releases-to-be-scaled-back-but-not-for-about-36-hours/story-e6freoof-1225986190427
At 9pm Wednesday Wivenhoe Dam was at 189 per cent, down from 191 per cent overnight, while Somerset Dam, which feeds into Wivenhoe, was down from 190 per cent to 186 per cent. Wivenhoe was releasing 215,000 megalitres, up from 205,000 megalitres earlier in the day, but still lower than a peak of 645,000 megalitres per day on Tuesday night.
Releases were expected to be increased to 301,000 megalitres per day when the downstream peak in the Brisbane River has passed. But note that it was reported that it takes about 36 hours for water released at the dam to arrive at city reaches of the Brisbane River. This suggests that the increased releases on Tuesday evening probably ADDED to the flood peak around 4am Thursday morning.
It was also reported that about 10,000 cu m of water per second was passing down city reaches on Wednesday - slightly higher than in the 1974 floods. Of this, 8000 cu m was from Wivenhoe Dam releases combined with lower Brisbane River and Lockyer River flows.
I think there are some questions to be answered about planning by the Brisbane City Council, and the operation of the flood control infrastructure. There might be good answers to those questions, but the understanding of SOI is one of the best pieces of climate science we have. Did the management of the catchment reflect that scientific understanding, and if not, why not?
Those who are trying to link this to climate change are simply in denial: there is nothing exceptional in the flood levels – they were worse before AGW could have kicked in.
An interesting (and sane!) article from MeteoGroup's Stephen Davenport, drawing parallels between the 1974 flood and the present one can be found here
"At any time there may be three reasons for torrential rains and floods in Australia: cyclones, persistent heavy rains for days or even weeks and individual severe thunderstorms or lines of slow-moving thunderstorms. Queensland has recently had all three.
While the extent of the devastation is hard to comprehend, a very similar flood disaster occurred across New South Wales and Queensland in 1974, and Brisbane was badly affected.
Prof. Kellow
Thank you for your extremely informative comment.
Dominic
AK
I think what you have stated "But all the figures indicated a substantial La Nina, with the December Southern Oscillation Index a record. At a minimum, they should have been expecting a substantial monsoon. Why then was the storage not emptied out to maximise its ability to manage the flood?" highlights how unprepared the authorities were to deal with flood mitigation with the water storage resources at hand.
Looks like there was also a "mega flood" in 1841. According to the commentary below the table in the link it was 7cm higher than the mega flood of 1894. This thing is clearly cyclical.
I don't suppose it will be long before the Hockey team start finding ways to show the Brisbane mega-flood of 1884 was actually lower than the current one. The emails will be flying now: 'we have to get rid of 1884'.
On BBC World at One, a gentleman from Reading University declined the opportunity, offered by Martha Kearny, to blame it all on global warming. He cited El Nina.
In the 1980's when I used to visit Brisbane occasionally the 1974 flood was a fresh memory. Estate agents selling houses would advertise it if houses they were selling were above the (I think) 50 foot contour and hence safe from flooding.They had maps readily available showing which streets and which suburbs were safe.
I do not remember the Brisbane flood being noticed much at the time in the UK, but do remember thinking in 1974 that there were an unusually large number of weather records being broken. Was 1974 by any chance yet another pronounced La Nina year?
Roger Pielke jr also discusses the chart:
http://rogerpielkejr.blogspot.com/2011/01/brisbane-floods-in-historical-context.html
"Sensitive stuff this coral. only lasted a few hundred million years or so..."
Last I heard, about 400 million years. Didn't it evolve in the Devonian when CO2 levels were ten times higher than today?
Here are the climate change projections for Queensland produced by CSIRO and the Australian Bureau of Meteorology
Far North Queensland
• Significant loss of biodiversity in Great Barrier Reef and Queensland Wet Tropics by 2020
• Increase in rainfall intensity and variability
• Towns, infrastructure and resorts in low-lying coastal areas vulnerable to higher flood or storm surge levels
• Higher risk of Cairns being inundated by 1-in-100-year storm surge by 2050
• Sea-level rise to cause salt-water intrusion in Torres Strait Islands
• Increased risk of water, food and vector-borne diseases.
Western Queensland
• Warming projected to be greatest in this region, particularly in south-western Queensland
• More severe droughts and heatwaves but increased rainfall intensity when it does rain
• Strong decline in rainfall could affect water quality, availability, and soil moisture.
Central Queensland
• Drying projected to continue
• Strong decline in rainfall and increased evaporation could affect soil moisture and availability and quality of water
• Water availability could affect the region’s key agricultural, industrial and mining activities.
South East Queensland
• Potential for more significant increases in inundation as a result of storm surges due to higher mean sea level and more intense weather systems
• Increase in 1-in-100-year storm tide events projected to be 0.45 m along the Sunshine Coast, mostly due to sea-level rise
• Less water available in future for cities, industries, agriculture and natural ecosystems
• Days over 35 °C expected to increase, affecting peak energy demand
• Increased pest and disease risk.
The only part of the state projected to have more severe droughts and heatwaves but increased rainfall intensity when it does rain is Western Queensland.
South East Queensland, the area hit by these floods, is projected to suffer from an increase in storm surges. The greatest danger to Brisbane based on climate change projections comes from the sea and not inland.
Mac
I would suggest that the UKMO get in touch with Australian Bureau of Meteorology if they can regionally predict to that level of accuracy to see if they have a spare computer going cheap!
7.3 mag Earth quake in Pacific ocean
1,000 miles ENE Brisbane Tsunami alert issued
It's often stated by warmists that incidences of extreme weather events are on the increase due to global warming. The sceptic counter to this has been that news coverage of these events in the modern era is more comprehensive than it was previously. So, I thought I would try to find out what international coverage there was of the Brisbane floods back in '74. Unfortunately, it seems most newspaper archives are behind paywalls. On the BBC's own "On This Day" site, I can find articles on Cyclone Tracy, which hit Darwin that year, but nothing on Brisbane or Queensland. I, personally, can remember Tracy being in the news, but cannot remember hearing or seeing anything about the Queensland floods. Can any of the other brits here, or our american cousins for that matter, shed any light on whether there was much in the way of media attention paid to this at the time? As an aside, interesting report on the '78 floods in India on the same site.
LC noted
It was cyclone Wanda that triggered the 1974 floods. Lots of stuff on the Web if you Google it.
7.3 mag Earth quake in Pacific ocean
1,000 miles ENE Brisbane Tsunami alert issued
Jan 13, 2011 at 4:38 PM | Lord Beaverbrook
I wonder if Martha Kearney will ask a leading question linking this to AGW...
I watched in disbelief the Newsnight Review on climate science last year where one of the guest artists cited the Haiti earthquake as evidence of AGW, and none of the other guests or the presenter [and I think it was Kearney] picked her up on it. Just found the it on youtube - http://www.youtube.com/watch?v=JiLFbToUep4 - Beth Derbyshire was the dumb artist and Martha was the host. Beth's mind-numbing interjection starts at 2 mins 25 seconds.
Back to the Brisbane floods, thanks to Prof Kellow for the excellent insight. I know nothing of the Brisbane catchment, but it does sound like the dams upstream could have impounded more water than they did (or been managed better to release/store water to minimise downstream flood peaks). I have looked in detail at what happened during the Perth (Scotland) floods in 1993 and the hydro-electric dams (mainly Loch Ericht, the Glen Lyon dams and the control weir on Loch Rannoch) played a significant role in holding back water. IIRC, the peak flow at Perth was around 2300cumecs, and had it not been for the hydro schemes it would have been at least 2500 and possibly 2800 cumecs, which would have led to much more serious damage to North Muirton and the low lying areas in the city centre. The authorities spent about £50 milllion building higher flood walls around the city after the 1993 flood, which should give protection from flows up to 2500cumecs, but afaik parts of the city are still prone to localised flooding as heavy rain / snowmelt tends to cause the burns and drains to back up behind the flood defences (there are pumps but they don't always cope).
Hi
I reside near Brisbane and work in an adjacent city (Logan City). Most residents of Qld / Aust have been glued to our televisions watching rolling coverage. It has been appalling to watch the devastation and loss unfold.
A few points:
1. Wivenhoe Dam operators have a legal obligation to return the dam to no more than 80% of drinking storage to enable maximum flood storage availability at all times. Just prior to the recent heavy rain, it remained at or above 100% of drinking storage for months.
go to this page and use the graphing option at bottom for Wivenhoe: http://seqwater.com.au/public/dam-levels
In the 2 weeks prior to the flood they had minor releases as it started to get larger inflows from upstream dam / catchment.
It was about 200% of drinking storage during the crisis.
Drinking storage is 1.1ML
Flood storage is another 1.4 ML
Total 2.5ML.
It went to high 2.1ML recently.
The preceding few days to the flood saw 600,000megalitres per day being released. Combined with the storm surge and heavy rain inundating Bremer River (which flooded Ipswich) and Lockyer Creek (both flow into the Brisbane River), we copped the flooding seen on your tvs.
2. The devastation is worse than 1974, despite a lower level. Far many more houses in swamp land than last time.
3. The "inland tsunami" that hit Toowoomba and Lockyer Valley were truly aweful. Houses were wiped off concrete slabs and just disintegrated. The most recent victim was found 80 km downstream. 55 people remain missing.
4. We had heavy rain all year in 2010. Our lord mayor accurately predicted brisbane could flood like 74 this year due to the ground being saturated and dams full. Sadly he was proven prescient. The rain has been going so long we celebrate a fine day. la nina is nesting here! And there are predictions for higher rainfall over next 2-3 months. We are at the start of our traditional wet season!
5. Drought - Qld had a pretty bad drought recently and that would have played on minds of dam operators. A lot of pressure was on them to keep dams at 100%. We'll see how this plays out.
We have a long road to recover here. Flooding is now affecting people from Cairns in north Qld right down to Tasmania - crazy times. To top it off a fire nut set off a bush fire in WA causing more heart ache.
sorry for long post
pete m
Sensitive stuff this coral. only lasted a few hundred million years or so..."
Last I heard, about 400 million years. Didn't it evolve in the Devonian when CO2 levels were ten times higher than today?
Jan 13, 2011 at 3:04 PM | Neal Asher
Yes Neal - that is why coral is so sensitive and cannot survive any further increase in CO2 levels
/sarc off
Unauthorised QUOTE from an expert:
"I think what you deniers do not realise is that the last major flood in Brisbance was in 1974.
Now when we talk our alarmist talk, we like to start in 1975, as that was the bottom of the last trough in the global zigzag. From then on, the temperature, at least as we recorded it, was up, up and away, which allows confident prediction of the conflagation still to come.
So the last great flood in Brisbane was before the start of our commentary period.
(Our memories are quite blank of those earlier primative times before writing was invented).
So the 2011 flood was UNPRECEEEEEEEEDENTED in modern times.
Remember CO2 means warming and warming means drought and drought means floods
And remember too, we'll have more of them, less of them, or no damn weather at all.
Whever scares you the most!
So THERE"
UNQUOTE
The last "Whever" can be roughly translated from the DAN to the englisg as "whatever"
englisg, binglish, whatever, I type proper like, but the computer displays what IT likes.
Pete M,
Thanks for sharing your insights. I have family not too far from where you are, and I am grateful they are not in any great harm. As a former resident of Graceville and before that East Ipswich, I feel for all affected.
Little could have been done for those affected by the flash flooding - save better warnings (always problematic), but the combination of poor flood plain planning and the questions over management of the flood mitigation infrastructure raises questions that must be answered. The Mayor of Brisbane appears to have been on the ball, but one wonders whether others were too focused on the question of water supply.
I saw this on another post somewhere:
8 March 2010: Courier Mail: Wivenhoe Dam ready for big spill in Brisbane River But Premier Anna Bligh and water managers say there will be no easing of permanent water saving measures. “We can’t be complacent and we must treat water as a precious resource not to be wasted whether our dams are 50 or 100 per cent,” Ms Bligh said… http://www.couriermail.com.au/news/queensland/wivenhoe-dam-ready-for-big-spill-in-brisbane-river/story-e6freoof-1225838427960
Would the peak have been lower if more water had been discharges earlier? That's the real question. I don't doubt there would have been flooding, but would it have been as extensive if the views of the Mayor governed the management of the dam?
Aynsley, the Wivenhoe is supposed to make floods 2 metres lower by being able to keep the flood storage in. The extra water coming down the river was 80% from Wivenhoe discharges. The reduction in their releases was squarly shown in the peak dropping from the predicted 5.5m to 4.6m. I think they overshot the prediction a little, as Ipswich high was 19.5m whereas they predicted 20.5m, and this was without any influence from Wivenhoe. Also the discharges take 36 hours to reach the CBD, and it only slowed 24 hours before the major peak, so, jury is out. They had a tough decision to make and I feel they were 12 hours too slow in reducing the outflow. Easy in hindsight!
The cleanup has begun - many volunteers. Community is pitching in. Some positives in all this sadness.
It would appear that the authrorities missed the opportunity of releasing water from the Wivenhoe Dam over the critical period of Jan 8th and 9th. If that had been done the flooding would have been less severe in and around Brisbane.
Also it is now being reported that due to the projected impact of climate change on South East Queensland the government prevented development along the coast line but not on flood plains. It is clear the authorties regarded that projected rising sea levels and increase in storms surges presented a more dangerous threat than inland flooding.
We may have witnessed man-made flooding in SE Queensland due to the impact on critical government thinking by climate change projections that predicted prolonged droughts and inudation by the seas.
There are lessons to be learned here.
I am sure I read this somewhere but sorry I can't remember where.
At some stage before the flooding of the Brisbane City, the discharge from the Wivenhoe had to be reduced because it interfered the release of flood waters from other areas into Brisbane River. Once pressure from those areas was reduced the discharge from the Wivenhoe was increased again by three-fold.
Certainly, a public inquiry will be held and many lessons will be learned. The insights gained will help many other flood prone areas around Australia and the world.
Looking at how much water has flooded through, and looking at what happens in less fortunate, unprepared regions of the world (i.e. Brazil and Pakistan), what happened in Queensland in the last two weeks (16 dead, 55 missing) is not a miracle, but a triumph of human ingenuity over reckless Acts of God. Hundreds, if not thousands, could have died in Queensland.
XX "But all the figures indicated a substantial La Nina, XX
The first time I heard of these things was about 15 years ago, when we were told "It is an event that happens every 7 years or so".
So how come ever since, every time we see the sun, or it rains a touch, or it snows, or Mrs Smith down the road hangs her washing out, four or five times per year, we here this...."thing" getting bandied about?
Your Grace
it was 1893
Bless you, my son.