
Friday
Sep052014
by  Josh
Josh
Josh Come on down - Josh 291
Josh Matt Ridley 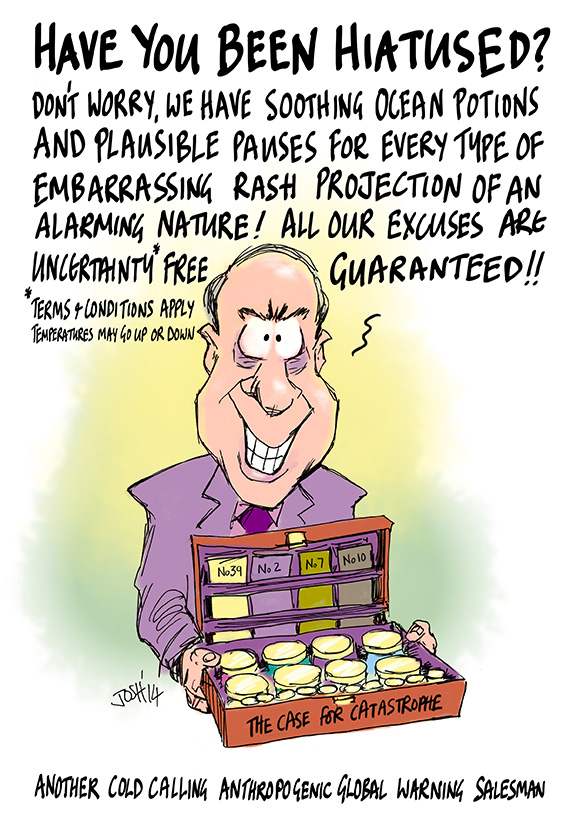
The hiatus is all the rage these days. Many thanks to Matt Ridley for his inspirational WSJ article.

Books
Click images for more details
A few sites I've stumbled across recently....
 Josh Josh Matt Ridley
The hiatus is all the rage these days. Many thanks to Matt Ridley for his inspirational WSJ article.
Reader Comments (11)
I'm not sure "cold calling" is quite right in the context; maybe "hot flush"?
Outstanding!!
Following new evidence, Matt Ridley admits to be cooling on his lukewarmer beliefs.
That makes him a true climate sceptic.
I wonder if he has pills for my hernia - it's a hiatus hernia!
(every one a Maserati)
In the linked article Matt Ridley writes that there has been 'no warming' over the period for which the 'trend' is not different to zero. It seems to me that similar arguments are made fairly widely amongst skeptics.
Perhaps pause enthusiasts could clarify for me what exactly is implied here.
Is the idea that a trend line, for example a least squares fit, is supposed to be an approximation to some sort of underlying temperature with shorter term fluctuations removed? Call it a 'trend temperature index'.
The 'no warming' argument is then that the 'trend temperature index' plotted as a straight line with zero gradient has the same value today as it did in, for example, 1997 we can say that there has been 'no warming'.
I then have two questions:
1. Is the above a fair summary of how the pause / plateau / hiatus is defined by many skeptics?
2. If so, then what meaning is attached to the 'trend temperature index' constructed by this means? How can the value of this index be evaluated in, e.g. 1990 or 1980?
Always amused at the "compulsion" to fit a line to data, perhaps a misplaced sense of "control" ? Just look at the plotted information, stand back and look at the big picture.
Reminds me of young engineers making presentations with a straight line fitted to what could only be described as a shotgun data plot with inferences that were in the realm of unicorns and fairy dust.
Mangochutney
Sleep sitting up and avoid stress. What ever you do don't take advice form the "Nurse"
That I take it is Dr Hansen, a man in whom some basic adult function of absorbing scary notions and refusing to stand on a chair screeching about them is missing. He saw, like many before him, including yours truly, and many after him, an eye-catching plot of rising CO2 levels, and noted rising temperatures in the 1980s, and furthermore was aware of theoretical speculations about CO2 as a driver of global mean temperatures. That was enough to get him on the kitchen chair, and he has been there since like some delicate lady convinced that mice are running about everywhere and desperate that something should be done about them.
JK -
The use of a least-squares fitted linear trend to define temperature change is a widespread practice among those of all persuasions, although I tend to think of it as a nasty habit. William Briggs has often made the point that if you want to know if it was warmer in year X than in year Y, just compare the temperatures!
Both methods have their disadvantages. Temperatures bounce around somewhat due to El Nino/La Nina, or volcanoes. Hence a single year may be unrepresentative -- one is usually more interested in the answer to the question of whether there has been any long-term change. On the other hand, OLS trend computation depends on the intervening years, which can affect the numerical answer without giving information on the "real" question. Both methods can be strongly affected by the end-points chosen, making them subject to cherry-picking.
As for comparisons with the past, that's usually done by computing the OLS trend over a fixed interval, then sliding the "window" in time and re-computing. For example, here is one with 30-year OLS trends, or this one with 15-year trends.
Thanks Mike Singleton and HaroldW.
That's two responses that seem rather skeptical of using OLS as the main support for claims of 'no global warming since year x'.
Since the practice seems rather widespread to me, is there anyone who can put forward a case in defense?
Speaking for myself, I don't see the point of claims such as "no warming since X." Or in the present case, "no statistically significant warming since X."
Surely it's more important to observe that, whichever metric one uses, that the temperature predictions of the CMIP3 and CMIP5 GCMs are noticeably higher than what is occurring. And that this fact casts considerable doubt on the reliability of predictions over even a decade, let alone to the end of the century or beyond.