


Thursday
Sep022010
by  Bishop Hill
Bishop Hill Refreeze?
Climate: WG2 Climate: other 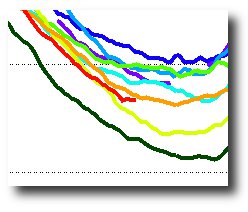 Just had a look at the JAXA sea ice extent graph, which I monitor from time to time. From the look of this year's chart - the red one - one could almost imagine that the refreeze has started, although of course it could be a blip. If this is the bottom, it's very early, the Arctic sea ice minimum usually being reached in the middle of September.
The global sea ice figure per Cryosphere today has in the meantime taken a downtick.
Reader Comments (7)
The trouble with these data is that they are too subjective. Sea ice area and sea ice extent are too subject to the vagaries of the wind and the measuring systems. They show some sort of trend, but best wait till well after re-freeze starts and then apply a good deal of uncertainty to the minimum data. I'm not sure whether Jaxa, ArcticRoos, NSIDC or anybody else shows the large uncertainty on these graphs.
meaningless blip. it'll fall some more. and time averaged global sea ice fell slightly with the step rise in global temperatures across 98. nothing surprising.
I also note that Jaxa state: "In principle, SIC data could have errors of 10% at most, particularly for the area of thin sea ice seen around the edge of sea-ice cover and melted sea ice seen in summer. Also, SIC along coastal lines could also have errors due to sub-pixel contamination of land cover in an instantaneous field of view of AMSR-E data." So two sources of error - or should that be uncertainty? There is a difference between error and uncertainty!
Blips are very common near the bottom (for obvious reasons); see 2005 for a good example. We should have a vague idea by the end of the month.
My guess is that it is a rebound after the Russian heat have blown over the Arctic.
Back to normal.
It's not a blip. I've been watching the North Pole Cam and it completely refroze in mid August. Going to be a cold winter.
I've never trusted the UIUC Cryosphere site, there are too many 'mistakes' and 'malfunctions'.
http://www.arctic.noaa.gov/gallery_np.html
Looks almost identical to the blip at the same time in 2007 - and we all know where that led!