
Wednesday
Mar242010
by  Bishop Hill
Bishop Hill Global sea ice normal
Climate: HSI 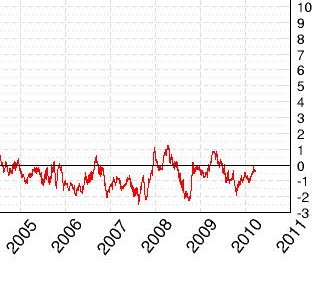 Global sea ice levels are pretty much in line with their long-term average. (Source: Cryosphere Today)

Books
Click images for more details
A few sites I've stumbled across recently....
 Bishop Hill Climate: HSI
 Global sea ice levels are pretty much in line with their long-term average. (Source: Cryosphere Today)
Reader Comments (61)
I have to ask readers on both sides of the divide: is there any evidence, any at all, of anthropogenic global warming, let alone the catastrophic sort?
The evidence has to be capable of standing up to more than two minutes' scrutiny, and should certainly not depend on computer models.
This evidence of sea ice area being unchanged for over 30 years is far worse than we thought!
Possibly relevant to the graph here, and also for those still following the Bart/Tamino/VS arguments over statistics and their use in climate analysis, Lubos Motl has another interesting contribution today, on the self similarity evident in temperature-time series, ie that the signal-to-noise ratio is independent of the time scale.
If you have the Wolfram Mathematica software and are interested in the maths you can also download his analysis based on the Central England Temperature dataset here.
'I have to ask readers on both sides of the divide: is there any evidence, any at all, of anthropogenic global warming, let alone the catastrophic sort?'
As a rider to that, could I ask if there are any AGW proponents who believe that it is good science to suggest that, because they can think of no other explanation for the (currently largely discontinued) trend of rising temperatures, it must be man-made?
*could I ask if there are any AGW proponents who believe that it is good science to suggest that, because they can think of no other explanation for the (currently largely discontinued) trend of rising temperatures, it must be man-made?*
This is a well-known logical fallacy known as the 'argument from ignorance', which along with confirmation bias, the bare assertion fallacy, the false dilemma and many others, are staples of the AGW position.
So I'll bet that there _are_ AGW proponents who think this is good "science".
I think both Julia Slngo and Bob Watson have recently repeated the mantra that there is no other explanation; therefore it must be man-made.
It's a catastrophe, Philip, there's no other word for it.
And thus if
this has to mean that we are entirely responsible for sea ice coverage not changing. Naughty, naughty boys. (Use your best Monty Python voices as you smack your own bottoms.)
"I think both Julia Slngo and Bob Watson have recently repeated the mantra that there is no other explanation; therefore it must be man-made."
While I am sure that is what they said, what they were 'thinking' was "It must be man-made; therefore there is no other explanation."
The remarkable similarity in rate and duration of 20th and 19th century warming trends, all very modest, and the existence of cooling cycles of similar durations (each accompanied by scaremongering in the media - once just harmless fun for journalists, but the recent mild warming one was different only in that it was elevated to a major issue by the remarkable skills of the IPCC), makes it clear that there is nothing whatsoever 'unusual' to explain, and that that explanation need not involve any man-made influence at all. There are more dramatic events in our climate history calling out for 'explanation', far more attention-getting than the 'all but lost in the noise' temperature variations of the last 200 years or so.
Global sea ice levels are pretty much in line with their long-term average.
"Global sea ice levels". (???)
The graph you cite refers to "global sea ice area" not levels.
Your title "Global sea ice normal" is misleading.
Far from it.
Climate Denial Crock of the Week - Ice Area vs Volume
http://www.youtube.com/watch?v=2nruCRcbnY0&feature=related
The Beeb ever the objective organ should be prepared to acknowledge the glaring facts of the Arctic Ocean sea ice recovery.
For the past three or four years they have parroted the mantra "were all doomed" because Al Gore/Jim Hansen/Hadcrut/IPCC/UN said so and to prove it the Arctic sea ice is disappearing!
If the sea ice disappeared I don't doubt that they would have a point, however it seems as usual it was all a storm in a very cold frozen teacup.
In the interests of balanced and reasonable broadcasting should they not temper their scurrilous scare tactics and inform the world, that the Polar region of the world is not 'melting' anytime soon, indeed it is reverting back to its 'norm' and it is still bl***y cold up there! -IMHO
Having just exited a long and vitriolic debate with a bunch of died-in-the-wool warmists over on Deltoid, I can answer the horizontal sea-ice graph quaestion on their behalf:
"Huh, that isn't climate - that's weather!"
And we can save a little time in future. If the line bobs down next year: "Huh, that isn't wea...."
Brent I think a 30year period is defined as climate, at least that's what I believe Mike Hulme said on the BBC yesterday. So get back over to deltoid and educate them!
G
Don Pablo: Good thinking; I hadn't thought of it that way round.
Cedric Katesby: It doesn't matter what the volume of ice is. It's the area of coverage that matters. I see no tipping point in the area.
Cedric
Please pass on your concerns over the use of the word "levels" to NSIDC, whose website currently says:
Geronimo,
No, please don't send me back into Deltoid again, I beg you! They were.... rude.
We did agree that 30 years is about right although I still find the distinction between weather and climate arbitrary. Using that arbitrariness against them, I quoted the famous Pr. Phil Jones of UEA: "Cooling is significant during the intervening period (1945–76) for North America, the Arctic, and Africa." So that makes it official - 31 years - yesssss - there was Global Cooling in that period, whilst CO2 concentrations were rising.
Nary a one of them had the decency to concede that point, and the entire debate was like talking to Jehovahs Witnesses.
I think you'll find that no ground exist for falsification of AGW. The main reason for this is there is no concrete thesis at it's core. It is a problem that is stated imprecisely, that can be re-phrased to accommodate the fickle and unpredictable nature of our wonderful and ever changing climate.
While climate is not predictable, I believe that meta prediction is possible and I'd like to have a crack at it here.
I predict that, as the extent of global sea ice increases, it becomes less significant as an indicator of AGW. Media trends already indicate that ice thickness will be increase in importance as extent increases.
It doesn't matter what the volume of ice is. It's the area of coverage that matters. I see no tipping point in the area.
Not according to the scientists.
Please pass on your concerns over the use of the word "levels"...
You don't get it. The graph you linked to does not support the title of your post.
...to NSIDC, whose website currently says:...
The NSIDC? You mean the National Snow and Ice Data Center? AWESOME.
I love those guys. I'm glad you accept their expertise in the matter. Here's what they have to say in their FAQ section:
Studying sea ice
Is Arctic sea ice really declining?
Yes, the data show that Arctic sea ice really is in a state of ongoing decline. The reason we know this is because satellites offer us a long-term record. As of September 2007, the September rate of sea ice decline since 1979 was approximately -10 percent per decade, or 72,000 square kilometers (28,000 square miles) per year. Although the 2009 sea ice minimum was larger than the past two years, the rate of decline since 1979 increased to -11.2 percent per decade. September is the month that Arctic sea ice melts back to its lowest point, known as the annual minimum, and is an important indicator of overall ice conditions. However, sea ice in the Arctic is in decline in all months and the decline is greater and the rate faster than natural causes could account for. For more on the basics of sea ice, read Quick Facts on Arctic Sea Ice.
Is Arctic sea ice starting to recover?
In 2008, Arctic sea ice reached a minimum extent that was about 10 percent greater than the record low of 2007, and the minimum extent in 2009 was greater than either 2007 or 2008. Does this mean that Arctic sea ice is beginning to recover?
Even though the extent of Arctic sea ice has not returned to the record low of 2007, the data show that it is not recovering. To recover would mean returning to within its previous, long-term range. Arctic sea ice in September 2008 remained 34 percent below the average extent from 1979 to 2000, and in September 2009, it was 24 percent below the long term average. In addition, sea ice remains much thinner than in the past, and so is more vulnerable to further decline. The data suggest that the ice reached a record low volume in 2008, and has thinned even more in 2009. Sea ice extent normally varies from year to year, much like the weather changes from day to day. But just as one warm day in October does not negate a cooling trend toward winter, a slight annual gain in sea ice extent over a record low does not negate the long-term decline.
In addition, ice extent is only one measure of sea ice. Satellite measurements from NASA show that in 2008, Arctic sea ice was thinner than 2007, and likely reached a record low volume. So, what would scientists call a recovery in sea ice? First, a true recovery would continue over a longer time period than two years. Second, scientists would expect to see a series of minimum sea ice extents that not only exceed the previous year, but also return to within the range of natural variation. In a recovery, scientists would also expect to see a return to an Arctic sea ice cover dominated by thicker, multiyear ice.
Once you start consulting the actual scientific community on matters of science, the denialist memes fade away.
Cedric
Why have you linked to an article discussing extent? I thought you were in favour of volume.
You'll need to explain why my title doesn't match the graph. Simply saying it doesn't leaves us all in the dark.
Why are you discussing Arctic only? That's cherrypicking.
Cedric
Can you just agree these grounds for falsification ...
"To recover would mean returning to within its previous, long-term range." ... your words
So what you are saying is this:
1) The falling extent of Arctic sea ice is an indicator of AGW.
2) If extent were to increase in 2010/2011 or at any time for that matter, to the 1979-2000 average, AGW would be counter-indicated.
Have I got this right? I think this is what you are almost saying ... but what you are never going to say.
You'll need to explain why my title doesn't match the graph.
Ok.
Your title is "Global sea ice normal".
That's just not true.
Why are you discussing Arctic only? That's cherrypicking.
Let's be clear. You mentioned the National Snow and Ice Data Center.
To the question "Is Arctic sea ice really declining?" The answer from them is "Yes".
That's a "Yes" to long term decline since 1979.
You want to talk about other ice to avoid cherry-picking? Greenland? Antarctica? Happy to discuss it.
What have you got?
Cite your sources.
What makes you think that "Global sea ice normal"?
If you like we can go back to people responsible for the Cryrosphere Today site (where you got the graph from) and and read what they have to say.
Sea ice extent averaged over the Northern Hemisphere has decreased correspondingly over the past 50 years (shown right). The largest change has been observed in the summer months with decreases exceeding 30%. Decreases observed in winter are more modest.
Link.
Here's a statement from their Atmospheric Sciences department in plain English:
Evidence continues to mount that human activities are altering the Earth’s climate on a global scale. The greatest challenge in understanding the global climate system is that our research must reach far beyond the atmosphere—to the oceans, land surfaces, vegetation, cryosphere, and even to the sun, the source of energy for our atmosphere. The rapid changes that have occurred in the earth’s climate system in the last two decades have brought a new sense of urgency in climate research. The University of Illinois is deeply involved in climate research at many levels, both within the department and in interdisciplinary research across the campus.
Link
@cedric
Your second part is an almost completely content-free paragraph. All it really says is 'we do climate research, and we think more research is needed'. No huge surprise there..it would be amazing if they said 'we now know it all and propose to disband ourselves'
And I just wonder what the physical meaning of an 'average of seaice extent' is. Can you explain....because since it is an annual cycle, if the extent in 2010 is the same as in 1980 or whenever, you cannot show that there has been any increase or decrease in the 30 years intervening. You can just say ..'the extent of seaice in 2010 is the same as it was in 1980'. What happened inbetween is irrelevant surely.
Cedric
All you have done is repeated your assertion. I asked you to explain why it isn't true. I am reading the graph, which is a whisker away from its long-term average and I am describing that as "normal". Please explain yourself or stop wasting my time.
Is this Cedric Katesby's first visit here? If so, it could be the start of something big. See http://thewhitedsepulchre.blogspot.com/2010/03/cedric-katesby-lives.html
Which is like claiming that a guy gasping for air who just took one of his ever rarer 'normal' breaths is in fact breathing normally and in rude health. This despite the doctors round his bedside who say otherwise.
Similarly, sea ice is only 'normal' if you pretend that the only piece of information is the current reading of global extent, and disregard the experts.
It's easy to demonstrate this - if the Bishop were to have started to opine on sea ice extent in 1979, and posted every day as to whether it was 'normal', 'above normal', or 'below normal', he'd be posting most days that it was below normal. If he continues to do so, his posts about 'normal ice' will become rarer still.
[BH adds: And the same applies to the low area in 2007, right?]
I am reading the graph, which is a whisker away from its long-term average and I am describing that as "normal".
That's not how the scientists read it. Either you are reading it wrong or the scientists that study this kind of a thing are wrong, including the ones that made the graph. Hmm.
Decline in Arctic Sea Ice Extent
Passive microwave satellite data reveal that, since 1979, winter Arctic ice extent has decreased about 4.2 percent per decade (Meier et al. 2006). Antarctic ice extent is increasing (Cavalieri et al. 2003), but the trend is small.
Decline in Arctic Sea Ice Extent
Passive microwave satellite data reveal that, since 1979, winter Arctic ice extent has decreased about 4.2 percent per decade (Meier et al. 2006). Antarctic ice extent is increasing (Cavalieri et al. 2003), but the trend is small.
Satellite data from the SMMR and SSM/I instruments have been combined with earlier observations from ice charts and other sources to yield a time series of Arctic ice extent from the early 1900s onward. While the pre-satellite records are not as reliable, their trends are in good general agreement with the satellite record and indicate that Arctic sea ice extent has been declining since at least the early 1950s.
(...later...)
Arctic and Antarctic Sea Ice Extent, 1979-2009: Although Arctic sea ice extent underwent a strong decline from 1979 to 2009, Antarctic sea ice underwent a slight increase. The Antarctic ice extent increases were smaller in magnitude than the Arctic increases, and some regions of the Antarctic experienced strong declining trends in sea ice extent. See the Arctic Sea Ice FAQ for more information.
(...later...)
Sea ice thickness has likewise shown substantial decline in recent decades (Rothrock et al. 1999). Using data from submarine cruises, Rothrock and collaborators determined that the mean ice draft at the end of the melt season in the Arctic has decreased by about 1.3 meters between the 1950s and the 1990s.
(...later...)
Examination of the long-term satellite record dating back to 1979 and earlier records dating back to the 1950s indicate that spring melt seasons have started earlier and continued for a longer period throughout the year (Serreze et al. 2007). Even more disquieting, comparison of actual Arctic sea ice decline to IPCC AR4 projections show that observed ice loss is faster than any of the IPCC AR4 models have predicted (Stroeve et al. 2007).
Last updated: 18 February 2010
National Snow and Ice Data Center
So how about the cherry-picking? Why don't them there durned scientists talk about the Antarctic sea ice? Huh? HUH????
I am reading the graph, which is a whisker away from its long-term average and I am describing that as "normal".
You are reading the graph like George Will. Bad move.
So how would a trained scientist read the graph?
Glad you asked....
Cedric
The graph is global sea ice area. Quoting articles that are (i) old and (ii) about Arctic only are not particularly relevant.
I now understand what you are trying to say. By "sea ice levels are normal" I mean that they are close to their long-term average.
Cedric. Please calm down and be careful with your tone. Please do not link to long documents elsewhere without explaining what it is you are referring to. Quotations help.
I'm amused at how unscientific it is to describe the current global sea ice area as "normal", while it apparently OK for there to be headlines like:
Ice withdrawal 'shatters record'
when some of the ice (and only in the Arctic) gets blown out of position in 2007.
Cedric, I'm a trained scientist (Chemistry, Imperial) with 20 years in research and industrial analysis. That graph shows a long term trend of sweet b**ger all; a short period of below normal levels in 2003-7 and a recovery from that very similar to previous episodes. The only major departure from 'normal' in what is a short record, is short, small,recent and not at all obviously correlated to any other climate observation. The paragraphs you quote are full of subjective comments and ifs and buts, and could be written by any O level student having a browse over complex data. The tendency of people (sceptics included) to try and impose linear trends on data of this type is frankly laughable. (And yes I'm dissing the 'scientists' that write such tosh). The growth in Antarctic ice is by no means 'slight' when measured by the same tools and with the same objectivity and the stats stand up to a real, significant increase. 'Global' levels may well be a mathematical construct, but they are used, and quoted, and are increasing.
Bishop,
Yes the same applies to the Arctic in 2007 - and at the time many people said it may simply have been a blip. The Arctic extent remains on a long term downward trend irrespective of 2007.
And yes if you'd posted every day about the Arctic being above normal, normal, or below normal, you'd by now have been posting pretty much every day that it was below normal - most of the time more than 2 std deviations from normal.
(And no it's not cherry picking to look at the Antarctic and Arctic separately as they are physically different and subject to very different changes)
Frank, go back and look at Google news for 2007. The reporting of the sea ice minimum was shock horror stuff.
It's cherrypicking to only look at the Arctic. You can look at both, but separately or the combined figure.
Does anyone know why NH and SH Sea Ice Area Charts at Cryosphere have not updated since January?
Bishop,
Much like the reporting of 'climategate' now, eh? They do tend to exaggerate, don't they? Maybe it's better to look for what the science says elsewhere.
The science that tells you wind contributed to 2007 is the same science that tells you global warming contributed to 2007 (and the long term trend in general).
That's what I said.
And the picture that emerges when you do that is one of global warming. Denying that this is anthropogenic is silly enough, but denying that it's happening at all is anti-science.
Frank, one moment you're counting oranges, the next apples. Anything less than 30years is loudly claimed to be 'weather' and now you're claiming that a record that is only just 30yrs old is conclusive proof of AGW? The concept of 'normal' with ice levels is at best contentious. The best one can say from this type of analysis is that more info is needed. When you put it together with the wider indicators (historical evidence, biological, etc,etc, lo and behold - nothing anomalous, either North or South. Take the wider view, and chill out.
I was arguing with Cedric about him only discussing Arctic.
"The science that tells you wind contributed to 2007 is the same science that tells you global warming contributed to 2007 (and the long term trend in general)."
Sorry?
Quoting articles that are (i) old and (ii) about Arctic only are not particularly relevant.
18 February 2010 is old? Wow.
All of the articles I posted to were...younger than your graph.
...Arctic only are not particularly relevant...
Not according to the scientists that made the graph.
The graph is about sea ice. The Number One region for sea ice by far is...the Arctic.
The Antarctic (for example) doesn't really do sea ice. It's a different environment.
If you want to throw in data from other regions then go ahead. I don't mind at all. It will make no significant difference.
What have you got that Cryrosphere Today, The National Snow and Ice Data Center and the British Antarctic Survey don't? Cite your sources. Let's do it.
By "sea ice levels are normal" I mean that they are close to their long-term average.
Oh? Is that all you meant? So you weren’t really trying to say that everything was all hunky-dory with the sea ice? Hmm, ok.
That’s good because if you were trying to say or imply that (hypothetically speaking) the sea ice was fine and therefore global warming is nonsense then that would be…um…wrong.
Dead wrong.
So, it's good that you weren't saying that. No problem then.
So–on the level of grain-sized facts, Will could have said, with accuracy, that on one day in December 2008, the global ice area was near or slightly lower than it was on that day in December 1979. He did not. I leave readers to ponder why he didn’t.
But as you reflect, consider how this rewrite would have sounded: According to the University of Illinois’ Arctic Climate Research Center, global sea ice is 1.34 million sq. km less now in February 2009 than in February 1979. This decrease in sea ice area is roughly equal to the area of Texas, California, and Oklahoma combined.”
It doesn’t quite have the same ring as the original.
I'm amused at how unscientific it is to describe the current global sea ice area as "normal"…
I don't find misrepresentation and/or misreading of science at all amusing. I find it disturbing and dangerous.
....while it apparently OK for there to be headlines like: Ice withdrawal 'shatters record'...
Headlines?
I never get my science information from the media.
Never.
I alway go straight to primary sources.
Like the National Snow and Ice Data Center, the CSIRO, The Royal Society, The American Meteorological Society, The Royal Meteorological Society, NOAA and every single scientific community of national or international standing on the planet.
Though my favourite is NASA. Hard to beat NASA for the latest information on climate change.
Always get your science information from science sources. There is no substitute.
Of course, standards may vary from person to person...
Cedric
I've asked you to watch your tone. Frank manages to disagree with me without assuming a troll-like manner. Please take a 24 hour time-out.
Bishop,
You spoke of ice being pushed around by wind, as if this were the entire explanation for what occurred in 2007 or indeed any other year. But global warming is another factor. It seems you are rather selective in hearing only the part of the scientific explanation that tells you what you want to hear.
Quidnunc,
Strawman, I claimed it shows global warming - not cooling, not no change, but warming. Also the record is longer than 30 years old (though the pre-satellite era data is not as good).
There is so much evidence for warming that it is silly to deny it - but knock yourself out.
Hi there Cedric
Thank you for your amusing approach and refreshingly light hearted tone.
I'm a little worried about you though. In your arguments, you constantly appeal to The Scientists. You make them sound God-like. I guess you really mean The Climatologists.
So I think the chances that you yourself are a scientist are slim, as if you were then you would know that The Scientists are also people, and that like most of The Non Scientists, they also have their own unique opinions which do not always agree with The Other Scientists.
Furthermore, just like in any profession, sport, or other human endeavour, there are good scientists, and there are rubbish ones. The latter category always outnumber the former by a good margin in every discipline, as evidenced by exams and to a larger extent, by life.
Therefore one must learn to be a little more critical of the opinions of others before assuming them wholesale for yourself. After all, it's more likely that they have come from someone in the rubbish category, rather than the good category, unless you have bothered to do your own homework first.
Personally, when presented with a graph like this or any other proposition, I prefer to rely on my own mathematical training and knowledge to form my own opinion, rather than seeking to borrow that of The Scientists.
For what it's worth, this humble physical scientist has observed constant and ongoing battles between competing theories in the understanding of the way things are since the time he first became interested as a small boy and subsequently made the long and arduous journey to learn enough real science and mathematics to understand things at a truly meaningful and profound level.
And each of those competing theories was supported by evidence, evidence leant different interpretations by it's proponents own version of The Scientists. In time some of The Scientists turned out to be wrong, but interestingly, that didn't necessarily mean they were all rubbish scientists.
Good scientists, who are always fundamentally curious seekers after truth, never dismiss new results by appeal to The Scientists whose theories are in danger of being overturned, even if they themselves are one of them.
Bad scientists on the other hand mostly just focus on publishing rubbish in order to keep the funding coming in. Climatologist anyone?
I thought about baiting one of the trolls myself, but it really is a waste of time. Their minds are already made up and the facts are irrelevant.
Trend from 1979 is nothing!
See these eyewitness reports http://thesequal.proboards.com/index.cgi?board=climate&action=display&thread=31&page=1
Brent is lying as usual. He turned up at Deltoid with the arrogant belief that he would pose a few "clever" questions under the guise of someone who isn't quite convinced. I blew his cover early. He tried trolling as a "believer". I blew that too. He then accused everyone of being "rude boys" (as a Specials fan that's quite the compliment!) for mocking his insincerity and lying.
Read it all here, you might learn a thing or two:
http://scienceblogs.com/deltoid/2010/03/the_empirical_evidence_for_man.php
And do you know what the saddest thing about you lot is? The only way you can do anything is to resort to lying and misrepresentation. And you don't seem to see anything wrong with that.
[BH adds: John, if you want to vent please do it somewhere else.]
The sea ice recovers to about the same level every year. It is the summer level that has the decline.
MikeN
Those are global figures. There shouldn't be any annual pattern there at all, should there?
Bishop
There is an annual global pattern due to the different thermal and physical properties of the two hemispheres. Antarctica is bigger (more Ice) and colder and is surrounded by lots of water. .
Ed
EdBhoy
Yes, but that's reflected in the actual areas. The anomaly should take that effect out, shouldn't it?
"There is an annual global pattern due to the different thermal and physical properties of the two hemispheres."
Aye, but the daily sea ice mean (lilac graph) is the daily average over the last 30 od years.
The red graph at the bottom shows how far off the daily average we are.
This appears to show that we're almost bang on the average for this time of year over the period in question.
Nial
MikeN,
Thanks for the heads up on the next fall back position for the AGW community.
Bishop
Sorry I thought we were looking at the extent / area rather than anomalies.
Looking at the anomaly graph it appears to show a 12 month period component of sorts. Would we expect this if we compare an annual signal with an average? If I can get hold of the data I'll try an FFT to pull out the frequency components in the anomaly.
"Looking at the anomaly graph it appears to show a 12 month period component of sorts."
Do you think so, looks pretty random to me.
"Would we expect this if we compare an annual signal with an average?"
Not if the average is calculated with accurate daily figures for the period.
"If I can get hold of the data I'll try an FFT to pull out the frequency components in the anomaly."
It'll be interesting to see what you find but I've got a pint on that there won't be a significant 12 month frequency component (if there is it suggests the average is wrong).
Nial.