


Discussion > The Moral and Intellectual Poverty of Climate Alarm
May 14, 2020 at 11:52 PM | Phil Clarke
George Monbiot 2009 " The first hockey-stick paper, produced by Michael Mann et al has been vindicated by subsequent studies (see the IPCC)."
Hardly a reliable source
 golf charlie
Challenge accepted.
Monbiot is scrupulous in sourcing his claims. Why not show where he has his facts wrong? Oh, let me guess, you cannot.
Over to you.
Phil Clarke
His favourite source is the guardian? WHO? PHE? NYT? WP?
etc. etc.
CNN?
Cherry-picking upside-downism?
Go Joe Biden! What a hero.
Charly
Monbiot is scrupulous in sourcing his claims. Why not show where he has his facts wrong? Oh, let me guess, you cannot.
Over to you.
May 15, 2020 at 12:14 AM Phil Clarke
Monbiot believes in Mann's Hockey Stick.
Over to you.
golf charlie
The first hockey-stick paper, produced by Michael Mann et al has been vindicated by subsequent studies (see the IPCC)."
No more than simple truth: there's even a list on wiki
Quantitative reconstructions have consistently shown earlier temperatures below the temperature levels reached in the late 20th century. This pattern as seen in Mann, Bradley & Hughes 1999 was dubbed the hockey stick graph, and as of 2010 this broad conclusion was supported by more than two dozen reconstructions, using various statistical methods and combinations of proxy records, with variations in how flat the pre-20th century "shaft" appears
The IPCC Third Assessment Report (TAR WG1) of 2001 cited the following reconstructions supporting its conclusion that the 1990s was likely to have been the warmest Northern Hemisphere decade for 1,000 years:[2]
• Mann, Bradley & Hughes 1998 "Global-scale temperature patterns and climate forcing over the past six centuries"
• Jones et al. 1998 "High-resolution palaeoclimatic records for the last millennium: interpretation, integration and comparison with General Circulation Model control-run temperatures".
• Pollack, Huang & Shen 1998 "Climate change record in subsurface temperatures: A global perspective".
• Mann, Bradley & Hughes 1999 "Northern hemisphere temperatures during the past millennium: Inferences, uncertainties, and limitations".
• Briffa 2000 "Annual climate variability in the Holocene: interpreting the message of ancient trees".
• Crowley & Lowery 2000 "How Warm Was the Medieval Warm Period?".
Cited in NRC Report (North Report)[edit]
North et al. 2006 highlighted six recent reconstructions, one of which was not cited in AR4:[3]
• Huang, Pollack & Shen 2000 "Temperature trends over the past five centuries reconstructed from borehole temperatures"
Cited in IPCC AR4[edit]
The IPCC Fourth Assessment Report (AR4 WG1) of 2007 cited the following reconstructions in support of its conclusion that the 20th century was likely to have been the warmest in the Northern Hemisphere for at least 1,300 years:[4]
• Jones et al. (1998) [also in TAR], calibrated by Jones, Osborn & Briffa 2001 "The Evolution of Climate Over the Last Millennium".
• Mann, Bradley & Hughes (1999) [also in TAR]
• Briffa (2000) [also in TAR], calibrated by Briffa, Osborn & Schweingruber 2004 "Large-scale temperature inferences from tree rings: a review".
• Crowley & Lowery 2000 "How Warm Was the Medieval Warm Period?" [also in TAR]
• Briffa et al. 2001 "Low-frequency temperature variations from a northern tree ring density network".
• Esper, Cook & Schweingruber 2002 "Low-Frequency Signals in Long Tree-Ring Chronologies for Reconstructing Past Temperature Variability",
recalibrated by Cook, Esper & D'Arrigo 2004 "Extra-tropical Northern Hemisphere land temperature variability over the past 1000 years".
• Mann & Jones 2003 "Global surface temperatures over the past two millennia."
• Pollack & Smerdon 2004 "Borehole climate reconstructions: Spatial structure and hemispheric averages".
• Oerlemans 2005 "Extracting a climate signal from 169 glacier records".
• Rutherford et al. 2005 "Proxy-based Northern Hemisphere surface temperature reconstructions: Sensitivity to method, predictor network, target season, and target domain".
• Moberg et al. 2005 "Highly variable Northern Hemisphere temperatures reconstructed from low- and high-resolution proxy data".
• D'Arrigo, Wilson & Jacoby 2006 "On the long-term context for late twentieth century warming".
• Osborn & Briffa 2006 "The spatial extent of 20th-century warmth in the context of the past 1200 years".
• Hegerl et al. 2006 "Climate sensitivity constrained by temperature reconstructions over the past seven centuries".
Cited in IPCC AR5[edit]
The IPCC Fifth Assessment Report (AR5 WG1) of 2013 cited the following reconstructions in support of its conclusion that for average annual Northern Hemisphere temperatures, "the period 1983–2012 was very likely the warmest 30-year period of the last 800 years (high confidence) and likely the warmest 30-year period of the last 1400 years (medium confidence)":[5]
• Pollack and Smerdon (2004) [also in AR4]
• Moberg et al. (2005) [also in AR4]
• D'Arrigo, Wilson & Jacoby (2006) [also in AR4]
• Frank, Esper & Cook (2007) "Adjustment for proxy number and coherence in a large-scale temperature reconstruction".
• Hegerl et al. (2007) "Detection of human influence on a new, validated 1500–year temperature reconstruction".
• Juckes et al. 2007 "Millennial temperature reconstruction intercomparison and evaluation".
• Loehle & McCulloch (2008) "Correction to: A 2000-year global temperature reconstruction based on non-tree ring proxies".
• Mann et al. 2008 "Proxy-based reconstructions of hemispheric and global surface temperature variations over the past two millennia".
• Mann et al. 2009 "Global Signatures and Dynamical Origins of the Little Ice Age and Medieval Climate Anomaly".
• Ljungqvist 2010 "A New Reconstruction of Temperature Variability in the Extra-Tropical Northern Hemisphere During the Last Two Millennia".
• Christiansen & Ljungqvist 2012 "The extra-tropical Northern Hemisphere temperature in the last two millennia: Reconstructions of low-frequency variability".
• Leclercq & Oerlemans (2012) "Global and Hemispheric temperature reconstruction from glacier length fluctuations".
• Shi et al. 2013 "Northern Hemisphere temperature reconstruction during the last millennium using multiple annual proxies".
Further reconstructions[edit]
• Smith et al. 2006 "Reconstructing hemispheric-scale climates from multiple stalagmite records".
• Lee, Zwiers & Tsao 2008 "Evaluation of proxy-based millennial reconstruction methods".
• Huang, Pollack & Shen 2008 "A late Quaternary climate reconstruction based on borehole heat flux data, borehole temperature data, and the instrumental record"
• Kaufman et al. 2009 "Recent warming reverses long-term arctic cooling".
• Tingley & Huybers 2010a "A Bayesian Algorithm for Reconstructing Climate Anomalies in Space and Time".
• Christiansen & Ljungqvist 2011 "Reconstruction of the Extratropical NH Mean Temperature over the Last Millennium with a Method that Preserves Low-Frequency Variability".
• Ljungqvist et al. 2012 "Northern Hemisphere temperature patterns in the last 12 centuries".
• Marcott et al. 2013 "A Reconstruction of Regional and Global Temperature for the Past 11,300 Years"
• PAGES 2k Consortium 2013 (78 researchers, corresponding author Darrell S. Kaufman) "Continental-scale temperature variability during the past two millennia"
• Raphael Neukom, Nathan Steiger, Juan José Gómez-Navarro, Jianghao Wang & Johannes P. Werner 2019 "No evidence for globally coherent warm and cold periods over the preindustrial Common Era"
• PAGES 2k Consortium 2019 "Consistent multidecadal variability in global temperature reconstructions and simulations over the Common Era"
Phil Clarke
May 15, 2020 at 6:02 PM Phil Clarke
Thank you for that partial list of dedicated Hockey Teamsters.
Did they all approve of Gergis too, with her Pages2k Consortium connections?
golf charlie
May 15, 2020 at 6:02 PM Phil Clarke
Rahmstorf is a Hockey Teamster, is he blaming the Climate Models or the Hockey Teamsters that programmed them?
https://notrickszone.com/2020/05/15/climate-alarmist-rahmstorf-quietly-concedes-models-are-crap-running-way-too-hot/
golf charlie
The ironically-named No Tricks Zone want you to believe that Rahmsdorf has declared the 'models are crap', even putting that phrase in quotes, as if he actually said that.
Naturally he did not, nor anything close. The piece is an interesting report discussing the new generation of models, some of which (14 out of 40 reviewed) show a higher sensitivity than the previous generation, and discussing new evidence that indicates the current, slightly less high estimate for sensitivity is more likely.
The title of this thread is fast becoming a great example of the Law of Unintended Consequences.
Because these very new models have not yet been thoroughly tested and analyzed, a final assessment cannot yet be made - as things stand today, however, I see no reason to abandon the previously accepted estimate of climate sensitivity.(Google Translate)But we should not forget: even based on the previous, somewhat less high estimate of climate sensitivity, we very quickly need a much more ambitious climate policy in order to still meet the Paris goals and expensive consequential damage, massive human suffering and irretrievable loss of animal and plant species to prevent.
Phil Clarke
May 16, 2020 at 10:52 AM Phil Clarke
The models are not right. Bollocks would be your preferred term. There is no reason why Taxpayers should pay for, and suffer from Hockey Teamster crap and bollocks.
What are Climate Scientists going to do, to correct their mistakes?
golf charlie
Here is an interesting view of “climate deniers”. Discuss.
Radical Rodent
May 17, 2020 at 6:16 PM Radical Rodent
No real need to discuss, it just proves that my teachers at school in the 1970s were right, so was H. Lamb.
William M Connolley can't adjust the archaeological record, and Climate Scientists can't argue about the 19th Century mid Atlantic bucketeers, or the decay in orbit of satellites.
golf charlie
The comparative study by researchers from the University of Exeter now shows that especially the warming since 1975 - the largest part of modern global warming - has turned out to be significantly too strong in the sensitive models. This conclusion is confirmed by recent analyzes by ETH Zurich, for which more models have already been evaluated. This is a reason to breathe a sigh of relief: At the moment there is some evidence that these models are not better than the old ones, but simply too sensitive. Because these very new models have not yet been thoroughly tested and analyzed, a final assessment cannot yet be made - as things stand today, however, I see no reason to abandon the previously accepted estimate of climate sensitivity.
(Google Translate)
Models are out of fashion right now.
clipe
Why should taxpayers waste money on an organisation which is merely a lobbying group for destructive climate alarmism? If the 'climate wing' came out from under the PR cover of the 'weather wing' then that would be a start. Separate them and cease all state funding of the campaigning climateers is what I would do. When scientists turn into advocates/zealots for a viewpoint then they are no longer scientists. They may see themselves as messiahs, they may see themselves as saving the world, but I see them spanned by the range which includes money-grabbing opportunists, ideologically-driven society haters, and naive simpletons. Don't want to pay them a penny more. I refer to the UK Met Office..
Here is their latest piece of puff and spin, ably shredded at NotaLotofPeopleKnowThat
John Shade
Why does Homewood show a graph of the lower troposphere when talking about the surface? He wants us to believe modern warming is driven by El Nino, why not just do a regression analysis? Why does he say the rate of sea level rise is steady when it is accelerating?. Why does he cherry-pick 2007 and say Arctic sea ice has been 'stable' since then when the data show a continuation of the long term decline?
Just more intellectual poverty.
Phil Clarke
"Just more intellectual poverty.
May 30, 2020 at 3:13 PM Phil Clarke"
Your first link produced : "Grant Foster1 and Stefan Rahmstorf2"
golf charlie
Didn't challenge on NALOPKT then Clarky ?
Why's that?
tomo
Homewood has no biographical info on his web page, but I have seen it reported that he is a retired accountant, which feels about right. I have strict rule: I only argue with strangers on the blog of one accountant at a time ;-)
Phil Clarke
OMG, you don't think Homewood is correct?
Phil Clarke
. I have strict rule: I only argue with strangers on the blog of one accountant at a time ;-)
May 30, 2020 at 8:58 PM Phil Clarke
You also believe everything you are paid to
golf charlie
gc
nah - Clarky's just a coward
tomo
Well, there's only so much fun to be had shooting fish in a barrel, but I just posted this:
Why use lower troposphere temperatures when the Met are pretty clearly referring to the surface? Ah, the surface record shows continuing warming after 1998 at the same rate as before.https://woodfortrees.org/plot/gistemp/from:1970/plot/gistemp/from:1970/trend/plot/gistemp/from:1998/trend
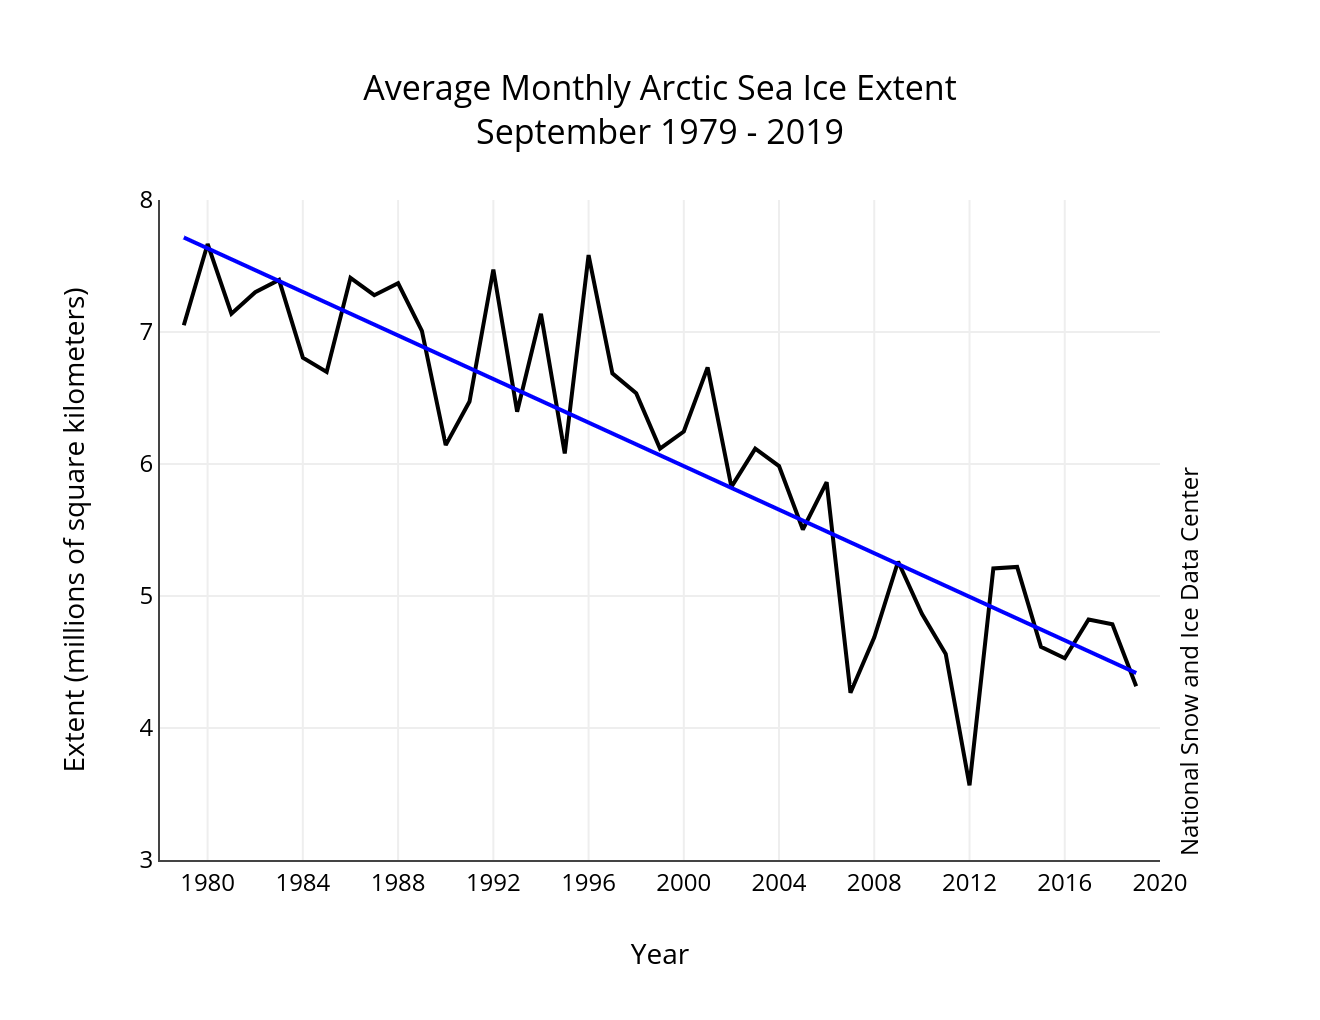
Arctic ice. 2007 is nothing more than a cherry-pick, start at 2006 or 2008 and the claim evaporates. Again, the data are consistent with a continuing steady decline.
http://nsidc.org/arcticseaicenews/files/2019/10/Figure-3.png
ENSO - instead of eyeballing the data, why not do a simple regression of ENSO strength vs global temperature? Ah, again, this has been done. Over the short term the La Nina/El Nino cycle has a big influence on global temps. But over the long term, it tends to cancel out. I guess that's why they call it an oscillation.
https://iopscience.iop.org/article/10.1088/1748-9326/6/4/044022
Homewood is a denier writing for deniers. The blog exists for the 8% or so who do not or more likely will not accept the overwhelming evidence for the existence of AGW. He has no interest in being correct or accurate. The arguments are so easily skewered it is clear he is not really trying, just providing sciencey-sounding cover for people to confirm their beliefs.
Phil Clarke
May 31, 2020 at 11:57 AM Phil Clarke
Has Climate Science yet found an explanation for the MWP and LIA other than getting Mann to erase them?
golf charlie
May 31, 2020 at 11:57 AM Phil Clarke
Has Climate Science yet found an explanation for the MWP and LIA other than getting Mann to erase them?
May 31, 2020 at 1:27 PM golf charlie
Sorry, i forgot to mention serial liar and data corrupter William M Connolley.
golf charlie
Six hours later, my comment at NALOPKT has not appeared, whilst others have been approved.
Seems the cowardice may lie elsewhere….
Phil Clarke
Monbiot? Really?
Ordure alert. PC's shoe soles!