 Bishop Hill
 Smoking gun?
 Nov 26, 2009
  Climate
 On the code thread, James Smith has just posted this comment:
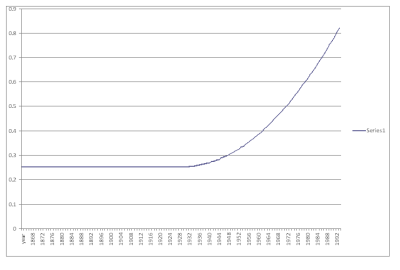
From the file pl_decline.pro: check what the code is doing! It's reducing the temperatures in the 1930s, and introducing a parabolic trend into the data to make the temperatures in the 1990s look more dramatic.
Could someone else do a double check on this file? Could be dynamite if correct.
 Bishop Hill
This is what all the fuss is about, but the reader who sent it thinks perhaps it may be a storm in a teacup. Still, it is strange that one would want to put an adjustment like this through a temperature series.

 Bishop Hill
In the comments, Steve McIntyre reckons this is probably Briffa's infamous Tornetrask bodge. This was an adjustment to deal with the divergence between tree ring widths and densities. So it's MXD versus RW, not MXD vs temperature.


Reader Comments (62)
If you want to see the tree ring data from Finland, go to www.lustia.fi. They have a 7000 year tree ring series from treeline pines in Lappland. According to site tree-rings fllow June-July temps faithfully.
You can see that growth was strongest in 1930's and 40's. That was also the warmest time there, summers were warmer than now. Recent warming in Lappland is due to increase of temps in wintertime, not during summers.
Jarmo,
Please, correct me if I'm wrong, but weren't the late 1930s and virtually all of the 1940s, years with unusually cold winters?
I'm only going from memory of the historical accounts of Stalin's disasterous (for the 600,000 + soviet troops killed and missing) invasion of Finland and the exceptionally cold weather which halted Hitler's invasion of Russia (after you Finns had made fighting Russia look easy).
June & July temps may be the major control of tree ring thickness at the northern limit of tree growth, but that is only recording 16.5% of the annual temperature record.
Keith
Jarmo,
I followed your link and all I got were adverts for cheap phones and usb sticks.
Please tell me you're not a spammer?
like by posting a working url?
Keith
www.lustia.fi
or
http://lustiag.pp.fi/
Thanks abuelo, "lustiag.pp.fi" gets me there.
Jarmo, sorry for any offence, the site does show a "lustia.fi" address but when I try it, I end up on a site with ads for consumer electronics.
K
From
http://lustiag.pp.fi/Advance-10K.htm
HE advance-10K project
Home page of ADVANCE-10K
Finnish activity in the Advance-10K project: All documentation here
A story how the gap problem was solved Pdf 3.9 MB)
Analysis of Dendrochronological variability and Associated Natural Climates in Eurasia
- the last 10000 years. Metla's plan for the Finnish part of the project. Pdf (248 KB)
Read also this Keith R.Briffa's introductive article as an initiative for the project: Trees as indicators of climate change.
I post a doc to google docs:
http://spreadsheets.google.com/pub?key=tVV0JAI6BxY8dqPiTWXlWUg&output=html
Its HADCRUT monthly data up to 10/2009
But i plot any 'strange' or i don't understand the data.
I plot the diference between up an low bias uncertainties
I think the bias uncertainties must be bigger on .. say 1850 than in 1990..
So the diference betwenn up 95% and low 95% of the bias uncertainties must go down from 1850 to 1990..
See two plots on doc.
Can explain plot 1937 - 1960?
if my error... can explain please?
Hi Keith,
Strange about the address, when I type www.lustia.fi, I get there straight away.
Anyway, about your questions: 1940 and 1942 were cold winters but there were also mild winters in 1930's.
Weather does vary alot. Funnily enough, the hottest day in record is from 1914 (35,9 C) in Turku, the coldest one from 1999 (-51,5C) in Kittilä. The coldest month in record is from 1985. (Kuusamo, average temp - 29,7)
One indicator of climate is the max sea ice extent on the Baltic. The following link shows a chart on page 39 covering years 1719-1995
http://www.baltic.vtt.fi/pdfs/meri32.pdf
Please bear with the ignoramus: is this legitimate then? Is this a reasonable way of dealing with this divergence?
Luc
No. He had one set of measurements that suggested temperatures were going up and one that suggested they were going down. He assumed that the ones going down must be affected by some unidentified factor and adjusted them up to where they should have been.
Jarmo,
Thanks, I downloaded the paper, I'll have to see if my one Finnish friend is in Ireland at the moment.
Keith
Not sure where to post this, but...
I invite Bishop Hill & others to my post “Long term solar forcing – A better explanation of global warming than CO2″ at my new blog The Hockey Schtick at
http://hockeyschtick.blogspot.com/2009/11/long-term-solar-forcing-better.html
to take a look at this amazing plot of solar activity vs. global temperature, which you can reproduce yourself and change parameters and massage data as you please:
http://3.bp.blogspot.com/_nOY5jaKJXHM/SxHvhQgGmzI/AAAAAAAAAOU/vj-CcEdOZPs/s1600/from_1875.png