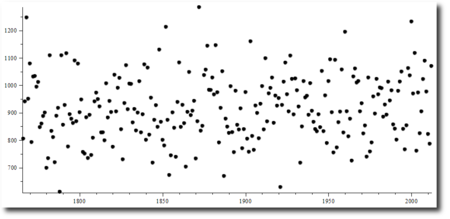
In the wake of the "more rain and more intense rain" story, Doug Keenan sends this graph of England & Wales rainfall records for 1766-2012 (click for larger; data here).
 Let's just say the trend towards more rainfall is not obvious. (As indeed is any trend towards less rainfall, which is said to be more likely by the UK Climate Impacts Programme).
[Updated to show England and Wales, rather than UK]
 Bishop Hill