There has been a lot of blog battling and twitter twootling started by this WSJ article
with climate crossness here and here and here, all brilliantly buffed and rebuffed by Matt Briggs
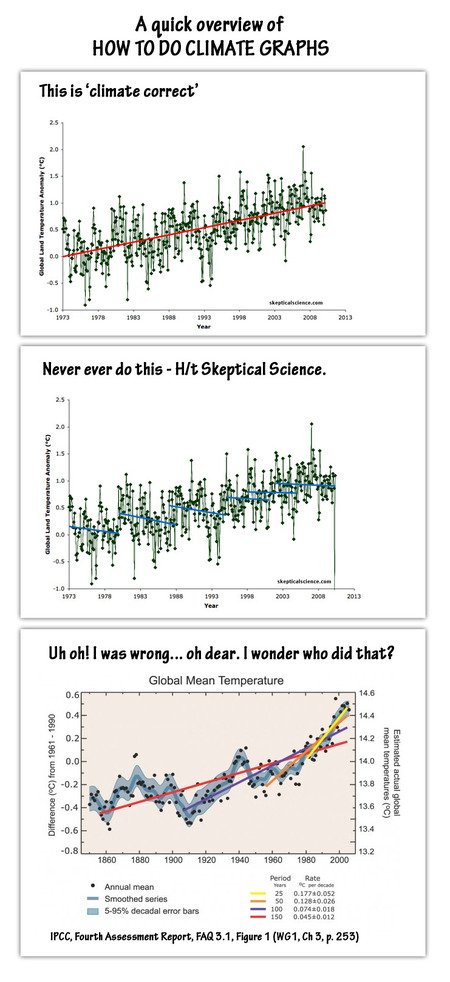
A lot of the argument was about 'how to do climate graphs' with input taken from Skeptical Science.
H/t MrSean2k at WUWT who finds a rather good example.
So here is a quick lesson in how to do Climate Graphs - please concentrate.
From Cartoonsbyjosh.com (click image for larger version)
