This is a guest post by Rob Wilson. Please note, this post forms part of a project for Rob's students and comments will be read and discussed by them. I will therefore be enforcing a fairly strict moderation policy.
As a dendroclimatologist, I am well used to noisy data. Addressing whether the mean “signal” in a sample is a robust reflection of the theoretical population is a key step in any dendrochronological (and statistical) analysis. With this in mind, I find it strange that there can be even any debate as to the “quality” of large scale temperature data-sets (HADLEY/CRU, NASA GISS and NOAA/NGDC) where, compared to trees, the issues related to “noise” (e.g. changes in instruments, movement of monitoring stations, non-ideal location of monitoring stations etc) seem much more trivial, in my mind, than the myriad of different tree and site specific factors that can influence tree-growth.
This is not a blog post about trees and climate however, but rather instrumental data and the robustness of large-scale trends.
A good general review on the issues of instrumental data biases is:
Peterson,T.C. et al, (1998). 'Homogeneity adjustments of in situ atmospheric climate data: a review.' International Journal of Climatology, 18 1493-1517
http://www.st-andrews.ac.uk/~rjsw/PalaeoPDFs/Peterson-etal-1998.pdf
Over the last 6 months, there has been much discussion and debate regarding the output and results of the Berkeley Earth Surface Temperature (BEST) team.
Using a similar but expanded data-set to HADLEY/CRU, NASA GISS and NOAA/NGDC, and different compilation methods, the independent BEST results are in general agreement with those of the other three groups. As far as I am aware, much of the BEST results and conclusions are still going through peer review, but I think their basic overall agreement with previous large scale analyses was not a surprising result to most meteorologists, climatologists and palaeoclimatologists.
This is not a post about validating the analyses of HADLEY/CRU, NASA GISS, NOAA/NGDC and BEST, but rather how to communicate some of the main issues to students as well as the general public. One could quite easily get lost in the blogosphere with respect to potential biases from the urban heat island, or from the non-ideal location of individual stations and how station locations may change over time, but when there is so much data, at least for much of the last 100 years (Figure 1), do such biases really pose a problem?
Firstly, one could encourage students/individuals to read some of the relevant recent papers:
Morice, C. P., J. J. Kennedy, N. A. Rayner, and P. D. Jones (2012), Quantifying uncertainties in global and regional temperature change using an ensemble of observational estimates: The HadCRUT4 dataset, J. Geophys. Res., doi:10.1029/2011JD017187, in press. http://www.metoffice.gov.uk/hadobs/hadcrut4/HadCRUT4_accepted.pdf
Jones, P. D., D. H. Lister, T. J. Osborn, C. Harpham, M. Salmon, and C. P. Morice (2012), Hemispheric and large-scale land surface air temperature variations: An extensive revision and an update to 2010, J. Geophys. Res., 117, D05127, doi:10.1029/2011JD017139. http://www.metoffice.gov.uk/hadobs/crutem4/CRUTEM4_accepted.pdf
P. Brohan, J.J. Kennedy, I. Harris, S.F.B. Tett and P.D. Jones, Uncertainty estimates in regional and global observed temperature changes: a new dataset from 1850. (2006) J. Geophys. Res, 111, D12106, doi:10.1029/2005JD006548. http://www.st-andrews.ac.uk/~rjsw/papers/Brohan-etal-2006.pdf
Hansen, J., R. Ruedy, Mki. Sato, and K. Lo, 2010: Global surface temperature change. Rev. Geophys., 48, RG4004, doi:10.1029/2010RG000345. http://pubs.giss.nasa.gov/docs/2010/2010_Hansen_etal.pdf
However, these are rather long and laborious papers and are aimed at the scientific community and may be too detailed for the average bod on the street – although I hope my students have attempted to go through them. What I wanted to do is try and communicate, more simply, the robustness of the observed warming signal noted in all four of the large data-set compilations.
In my 3rd/4th year module (Reconstructing Global Climate since the Romans), I set my students a simple challenge. They, as a group of around 20 students, would individually derive their own large-scale mean composite series of Northern Hemisphere (NH) annual land temperatures from a small number of randomly chosen station records. How well do their individual records compare with published NH temperature series?
For background, these are physical geography students and are not the most numerate individuals in the world. However, they can use Excel, understand the concept of a time series and know how to average data. So – this situation is not quite an 'infinite number of mindless monkeys and typewriters', but rather a finite number of hard-working 'monkeys' with just a couple of hours to play.
The challenge was purposely simple.
Each student would:
- Download (using the Dutch Met Office Explore (KNMI – http://climexp.knmi.nl)) FIVE random land station records, each covering at least ~100 years, from somewhere in the extra-tropical Northern Hemisphere – there are many stations (Figure 1).
;) Figure 1: Distribution of extra-tropical land temperature records that go back prior to 1910.
Figure 1: Distribution of extra-tropical land temperature records that go back prior to 1910.
- To ensure reasonable coverage around the planet, the students were to download 2 records from North America and 3 from across Eurasia.
- The station data were to be extracted from the GHCN (ALL) data-set which includes BOTH homogenised (corrected) and non-homogenised (uncorrected) data-sets. Using this version of the GHCN data-set would introduce more noise into the exercise as individual records could potentially be influenced by all sorts of homogeneity issues (see Peterson reference above).
- Once the individual station records were downloaded, the students had to import the ascii text column files into Excel and simply calculate an annual mean series for each station record. Missing values, denoted by -999.9, had to be first removed, and the students could only allow the calculation of an annual mean if there were measurements from at least 7 months for any year.
- The students then had to transform the station mean annual series to temperature anomalies relative to a 30 year common period – ideally 1961-1990 – but in some cases due to different end dates of the series, a few students used slightly different period (e.g. 1951-1980).
- Finally, the students averaged their 5 anomaly series together to derive their own personal NH mean annual temperature anomaly series with which they could make comparison to the more robustly derived and better replicated large scale NH temperature series (e.g. CRUT4).
There are some caveats to keep in mind.
- It is possible that the 5 stations chosen by each student were not entirely independent although a quick look through their data files did not flag up any obvious doubling up of the same station data.
- As the number of records changes through time, the variance in the final mean series would increase as the number of input records decreases. No attempt at variance stabilisation was made.
- It is almost certain that the 5 stations each student chose were also included in the HADLEY/CRU, NASA GISS, NOAA/NGDC and BEST data-sets so any comparison to any of these published series is not entirely independent.
Results
Figure 2 presents all 20 student-generated NH mean annual series. As would be expected from NH time series derived from just 5 records, there are some differences and the degree of noise increases back in time as the number of records decrease in each student iteration. However, just from eye-balling, there is a clear common signal between the records at least for the last ~100 years or so, and warming in recent decades is noted in most of the records.
;) Figure 2: Time-series of individual student 5 station NH mean series.
Figure 2: Time-series of individual student 5 station NH mean series.
The correlations of these individual records with NH CRUT4 (over the common period of overlap from 1850-2010) ranges from 0.39 to 0.77 (Figure 3 - mean 0.61).
 Figure 3: Histogram of correlations between each student 5 record mean NH series with CRUT4 annual extra-tropical temperatures
As these correlations may be influenced (inflated) by the positive trends in the data in the recent period, I also transformed the time-series to 1st differences to assess the coherence between the individual records and NH CRUT4 at interannual timescales. As expected, the correlations values weaken – the range being 0.20 to 0.70 (Figure 4 - mean 0.46).
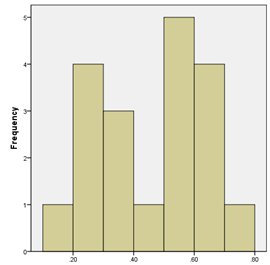 Figure 4: Histogram of correlations (after 1st difference transform) between each student 5 record mean NH series with CRUT4 annual extra-tropical temperatures
So – there is some degree of coherence between the individual student records but due to the low number of input series in each student NH mean series, there is, unsurprisingly, still quite a range in individual record agreement with NH CRUT4. However, by pooling the data from the 20 students together can we improve on their individual results?
Figure 5 shows the simple average time-series (blue line) of the 20 student records compared with mean annual NH CRUT4 temperatures (red line). The correlation between the two series (1850-2010) is 0.89 (0.77; 1st differenced). The salient features in NH CRUT4 are picked up very well in the student-derived NH mean series. No adjustment to the variance has been made.
;) Figure 5: Comparison of CRUT4 annual extra-tropical temperatures (red) with a simple average of all 20 student 5 record means series (blue).
Figure 5: Comparison of CRUT4 annual extra-tropical temperatures (red) with a simple average of all 20 student 5 record means series (blue).
Concluding thoughts
This experiment was purposely set up to be as simple in methodological approach as possible. Having said that, I have to admit that the final comparison is much better than I would have expected. This surely hints at the 'strength' and overall spatial homogeneity of the warming signal seen over the Northern Hemisphere and it clearly can be robustly captured even when using only a very small subset of the available data. Such a simple approach and the use of only a relatively small number of records (~100) would be sensitive to individual station biases if they were systematically coherent over large area. From this analysis, there appears to be no obvious biases in the final mean, which suggests that such biases are mostly station specific and have been minimised through the simple averaging process.
This simple approach does not specifically test whether there is a significant urban heat island effect although there is no obvious deviation between the noisier students 'series and CRUT4 which, might be expected if the UHI was a significant problem in some 'uncorrected' station records. Perhaps next year, I will get the students to ONLY access rural stations to address this.
Although there is more to palaeoclimatology than simply large-scale averages (i.e. spatial reconstructions are the ideal), this simple analysis does indicate that robust reconstructions of NH temperatures can be derived from relatively low numbers of proxy records so long as the constituent proxy records are robust estimates of LOCAL temperatures. My 2007 paper also goes into some detail on this issue:
Wilson, R., D’Arrigo. R., Buckley, B., Büntgen, U., Esper, J., Frank, D., Luckman, B., Payette, S. Vose, R. and Youngblut, D. 2007. A matter of divergence – tracking recent warming at hemispheric scales using tree-ring data. JGR - Atmospheres. VOL. 112, D17103, doi:10.1029/2006JD008318. http://www.st-andrews.ac.uk/~rjsw/all%20pdfs/Wilsonetal2007b.pdf
Whether looking at temperature sensitive trees or instrumental series, the coherence in the 'sample' signal is stronger at longer timescales and more data are needed to derive a robust mean series at interannual timescales. Here the final NH mean was derived from around 100 series. As proxy records are noisy representations of local temperatures, we will undoubtedly need more proxy records than we would instrumental series at interannual timescales. The following paper, although statistically rather heavy, covers this issue well:
Jones, P. Osborn, T and Briffa, K. 1997. Estimating Sampling Errors in Large-Scale Temperature Averages. Journal of Climate. 10: 2548-2568. http://www.st-andrews.ac.uk/~rjsw/PalaeoPDFs/Jonesetal1997.pdf
What is the take home message from all of this? Well – in my mind, it is not always necessary to try and exactly replicate a study to show if it is robust or not. The simple analysis discussed here clearly indicates the robust nature of the warming signal over the past 130 years as expressed in a variety of published datasets. Despite much criticism towards meteorologists about data availability, much of the data is already freely available and anyone can undertake complex (BEST) or simple (herein) analyses for comparison to previous results. I do not think there are many (or any?) sceptics out there that disagree that the climate has warmed over the past century or so. However, it is important that the uncertainties in instrumental series are quantified both at local and large-scales. I believe the literature (cited above) does a good job in this regard especially for large-scale mean series. Let’s not get too hung up about problems of individual station records, although such influences will always be more significant in data-sparse regions (e.g. in the Arctic).